BB&T 2009 Annual Report Download - page 145
Download and view the complete annual report
Please find page 145 of the 2009 BB&T annual report below. You can navigate through the pages in the report by either clicking on the pages listed below, or by using the keyword search tool below to find specific information within the annual report.-
 1
1 -
2
-
3
-
4
-
5
-
6
-
7
-
8
-
9
-
10
-
11
-
12
-
13
-
14
-
15
-
16
-
17
-
18
-
19
-
20
-
21
-
22
-
23
-
24
-
25
-
26
-
27
-
28
-
29
-
30
-
31
-
32
-
33
-
34
-
35
-
36
-
37
-
38
-
39
-
40
-
41
-
42
-
43
-
44
-
45
-
46
-
47
-
48
-
49
-
50
-
51
-
52
-
53
-
54
-
55
-
56
-
57
-
58
-
59
-
60
-
61
-
62
-
63
-
64
-
65
-
66
-
67
-
68
-
69
-
70
-
71
-
72
-
73
-
74
-
75
-
76
-
77
-
78
-
79
-
80
-
81
-
82
-
83
-
84
-
85
-
86
-
87
-
88
-
89
-
90
-
91
-
92
-
93
-
94
-
95
-
96
-
97
-
98
-
99
-
100
-
101
-
102
-
103
-
104
-
105
-
106
-
107
-
108
-
109
-
110
-
111
-
112
-
113
-
114
-
115
-
116
-
117
-
118
-
119
-
120
-
121
-
122
-
123
-
124
-
125
-
126
-
127
-
128
-
129
-
130
-
131
-
132
-
133
-
134
-
 135
135 -
 136
136 -
 137
137 -
 138
138 -
 139
139 -
 140
140 -
 141
141 -
 142
142 -
 143
143 -
 144
144 -
 145
145 -
 146
146 -
 147
147 -
 148
148 -
 149
149 -
 150
150 -
 151
151 -
 152
152 -
 153
153 -
 154
154 -
 155
155 -
156
-
157
-
158
-
159
-
160
-
161
-
162
-
163
-
164
-
165
-
166
-
167
-
168
-
169
-
170
 |
 |

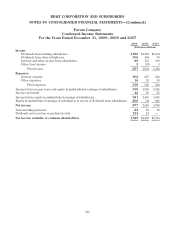
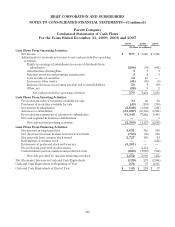
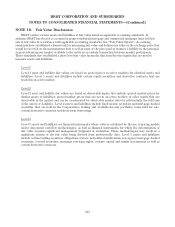
BB&T CORPORATION AND SUBSIDIARIES
NOTES TO CONSOLIDATED FINANCIAL STATEMENTS—(Continued)
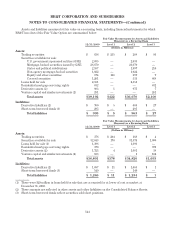
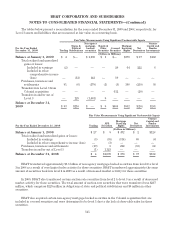
The tables below present a reconciliation for the years ended December 31, 2009 and 2008, respectively, for
Level 3 assets and liabilities that are measured at fair value on a recurring basis.
Fair Value Measurements Using Significant Unobservable Inputs
For the Year Ended
December 31, 2009 Trading
States &
Political
Subdivisions
Non-agency
mortgage-
backed
securities
Equity &
Other
Securities Covered
Securities
Mortgage
Servicing
Rights Net
Derivatives
Venture
Capital and
Similar
Investments
(Dollars in Millions)
Balance at January 1, 2009 $ 4 $— $ 1,098 $ 1 $— $370 $ 37 $182
Total realized and unrealized
gains or losses:
Included in earnings (2) — — — 20 64 222 6
Included in other
comprehensive income
(loss) — (12) 142 — 19 — — —
Purchases, issuances and
settlements 91 (6) (179) (1) (3) 398 (259) 93
Transfers into Level 3 from
Colonial acquisition — — — — 632 — (20) —
Transfers in and/or out of
Level 3 — 228 (1,061) 9 — — — —
Balance at December 31,
2009 $ 93 $210 $ — $ 9 $668 $832 $(20) $281
For the Year Ended December 31, 2008
Fair Value Measurements Using Significant Unobservable Inputs
Trading AFS
Securities
Mortgage
Servicing
Rights Net
Derivatives
Venture
Capital and
Similar
Investments
(Dollars in Millions)
Balance at January 1, 2008 $ 27 $ 9 $ 472 $ 2 $128
Total realized and unrealized gains or losses:
Included in earnings (3) (35) (314) 68 (8)
Included in other comprehensive income (loss) — (3) — — —
Purchases, issuances and settlements (19) 5 212 (33) 62
Transfers in and/or out of Level 3 (1) 1,123 — — —
Balance at December 31, 2008 $ 4 $1,099 $ 370 $ 37 $182
BB&T transferred approximately $1.1 billion of non-agency mortgage-backed securities from level 2 to level
3 in 2008 as a result of very limited sales activity for these securities. BB&T transferred approximately the same
amount of securities back into level 2 in 2009 as a result of increased market activity for these securities.
In 2009, BB&T also transferred certain auction rate securities from level 2 to level 3 as a result of decreased
market activity for these securities. The total amount of auction rate securities that were transferred was $237
million, which comprises $228 million in obligations of state and political subdivisions and $9 million in other
securities.
BB&T also acquired certain non-agency mortgage-backed securities in the Colonial acquisition that are
included in covered securities and were determined to be level 3 due to the lack of observable sales for these
securities.
145