BB&T 2009 Annual Report Download - page 70
Download and view the complete annual report
Please find page 70 of the 2009 BB&T annual report below. You can navigate through the pages in the report by either clicking on the pages listed below, or by using the keyword search tool below to find specific information within the annual report.-
 1
1 -
2
-
3
-
4
-
5
-
6
-
7
-
8
-
9
-
10
-
11
-
12
-
13
-
14
-
15
-
16
-
17
-
18
-
19
-
20
-
21
-
22
-
23
-
24
-
25
-
26
-
27
-
28
-
29
-
30
-
31
-
32
-
33
-
34
-
35
-
36
-
37
-
38
-
39
-
40
-
41
-
42
-
43
-
44
-
45
-
46
-
47
-
48
-
49
-
50
-
51
-
52
-
53
-
54
-
55
-
56
-
57
-
58
-
59
-
 60
60 -
 61
61 -
 62
62 -
 63
63 -
 64
64 -
 65
65 -
 66
66 -
 67
67 -
 68
68 -
 69
69 -
 70
70 -
 71
71 -
 72
72 -
 73
73 -
 74
74 -
 75
75 -
 76
76 -
 77
77 -
 78
78 -
 79
79 -
 80
80 -
81
-
82
-
83
-
84
-
85
-
86
-
87
-
88
-
89
-
90
-
91
-
92
-
93
-
94
-
95
-
96
-
97
-
98
-
99
-
100
-
101
-
102
-
103
-
104
-
105
-
106
-
107
-
108
-
109
-
110
-
111
-
112
-
113
-
114
-
115
-
116
-
117
-
118
-
119
-
120
-
121
-
122
-
123
-
124
-
125
-
126
-
127
-
128
-
129
-
130
-
131
-
132
-
133
-
134
-
135
-
136
-
137
-
138
-
139
-
140
-
141
-
142
-
143
-
144
-
145
-
146
-
147
-
148
-
149
-
150
-
151
-
152
-
153
-
154
-
155
-
156
-
157
-
158
-
159
-
160
-
161
-
162
-
163
-
164
-
165
-
166
-
167
-
168
-
169
-
170
 |
 |

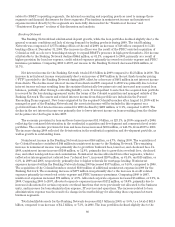
BB&T’s interest rate sensitivity is illustrated in the following table. The table reflects rate-sensitive positions
at December 31, 2009, and is not necessarily indicative of positions on other dates. The carrying amounts of interest
rate sensitive assets and liabilities are presented in the periods in which they next reprice to market rates or mature
and are aggregated to show the interest rate sensitivity gap. To reflect anticipated prepayments, certain asset and
liability categories are shown in the table using estimated cash flows rather than contractual cash flows.
Table 22
Interest Rate Sensitivity Gap Analysis
December 31, 2009
Within
One
Year
One to
Three
Years
Three to
Five
Years
After
Five
Years Total
(Dollars in millions)
Assets
Securities and other interest-earning assets (1,4) $ 6,981 $ 7,769 $ 4,932 $16,120 $ 35,802
Federal funds sold and securities purchased under resale
agreements or similar arrangements 398 — — — 398
Loans and leases (2) 72,351 15,727 7,600 10,529 106,207
Total interest-earning assets 79,730 23,496 12,532 26,649 142,407
Liabilities
Client time deposits 26,177 9,933 1,373 3 37,486
Other client deposits with no stated maturity (3) 21,380 13,654 3,499 11,796 50,329
Other interest-bearing deposits (4) 6,728 1,151 — 326 8,205
Federal funds purchased, securities sold under repurchase
agreements and Short-term borrowed funds 8,106 — — — 8,106
Long-term debt (4) 5,133 3,338 1,270 11,635 21,376
Total interest-bearing liabilities 67,524 28,076 6,142 23,760 125,502
Asset-liability gap $12,206 $ (4,580) $ 6,390 $ 2,889
Cumulative interest rate sensitivity gap $12,206 $ 7,626 $14,016 $16,905
(1) Securities based on amortized cost.
(2) Loans and leases include loans held for sale and are net of unearned income.
(3) Projected runoff of deposits that do not have a contractual maturity date was computed based upon decay
rate assumptions developed by bank regulators to assist banks in addressing FDICIA rule 305.
(4) The maturity periods have been adjusted to reflect the impact of hedging strategies.
Management uses Interest Sensitivity Simulation Analysis (“Simulation”) to measure the sensitivity of
projected earnings to changes in interest rates. The Simulation model projects net interest income and interest
rate risk for a rolling two-year period of time. Simulation takes into account the current contractual agreements
that BB&T has made with its customers on deposits, borrowings, loans, investments and commitments to enter
into those transactions. Furthermore, the Simulation considers the impact of expected customer behavior.
Management monitors BB&T’s interest sensitivity by means of a computer model that incorporates the current
volumes, average rates earned and paid, and scheduled maturities and payments of asset and liability portfolios,
together with multiple scenarios of projected prepayments, repricing opportunities and anticipated volume
growth. Using this information, the model projects earnings based on projected portfolio balances under multiple
interest rate scenarios. This level of detail is needed to simulate the effect that changes in interest rates and
portfolio balances may have on the earnings of BB&T. This method is subject to the accuracy of the assumptions
that underlie the process, but management believes that it provides a better illustration of the sensitivity of
earnings to changes in interest rates than other analyses such as static or dynamic gap. In addition to Simulation
analysis, BB&T uses Economic Value of Equity (“EVE”) analysis to focus on changes in capital given potential
changes in interest rates. This measure also allows BB&T to analyze interest rate risk that falls outside the
analysis window contained in the Simulation model. The EVE model is a discounted cash flow of the entire
portfolio of BB&T’s assets, liabilities, and derivatives instruments. The difference in the present value of assets
minus the present value of liabilities is defined as the economic value of BB&T’s equity.
70