BB&T 2009 Annual Report Download - page 115
Download and view the complete annual report
Please find page 115 of the 2009 BB&T annual report below. You can navigate through the pages in the report by either clicking on the pages listed below, or by using the keyword search tool below to find specific information within the annual report.-
 1
1 -
2
-
3
-
4
-
5
-
6
-
7
-
8
-
9
-
10
-
11
-
12
-
13
-
14
-
15
-
16
-
17
-
18
-
19
-
20
-
21
-
22
-
23
-
24
-
25
-
26
-
27
-
28
-
29
-
30
-
31
-
32
-
33
-
34
-
35
-
36
-
37
-
38
-
39
-
40
-
41
-
42
-
43
-
44
-
45
-
46
-
47
-
48
-
49
-
50
-
51
-
52
-
53
-
54
-
55
-
56
-
57
-
58
-
59
-
60
-
61
-
62
-
63
-
64
-
65
-
66
-
67
-
68
-
69
-
70
-
71
-
72
-
73
-
74
-
75
-
76
-
77
-
78
-
79
-
80
-
81
-
82
-
83
-
84
-
85
-
86
-
87
-
88
-
89
-
90
-
91
-
92
-
93
-
94
-
95
-
96
-
97
-
98
-
99
-
100
-
101
-
102
-
103
-
104
-
 105
105 -
 106
106 -
 107
107 -
 108
108 -
 109
109 -
 110
110 -
 111
111 -
 112
112 -
 113
113 -
 114
114 -
 115
115 -
 116
116 -
 117
117 -
 118
118 -
 119
119 -
 120
120 -
 121
121 -
 122
122 -
 123
123 -
 124
124 -
 125
125 -
126
-
127
-
128
-
129
-
130
-
131
-
132
-
133
-
134
-
135
-
136
-
137
-
138
-
139
-
140
-
141
-
142
-
143
-
144
-
145
-
146
-
147
-
148
-
149
-
150
-
151
-
152
-
153
-
154
-
155
-
156
-
157
-
158
-
159
-
160
-
161
-
162
-
163
-
164
-
165
-
166
-
167
-
168
-
169
-
170
 |
 |

BB&T CORPORATION AND SUBSIDIARIES
NOTES TO CONSOLIDATED FINANCIAL STATEMENTS—(Continued)
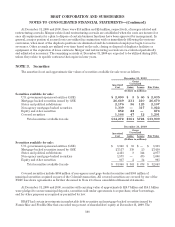
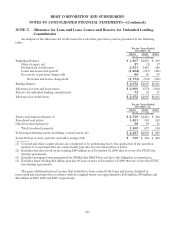
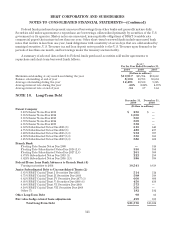
NOTE 5. Allowance for Loan and Lease Losses and Reserve for Unfunded Lending
Commitments
An analysis of the allowance for credit losses for each of the past three years is presented in the following
table:
For the Years Ended
December 31,
2009 2008 2007
(Dollars in millions)
Beginning Balance $ 1,607 $1,015 $ 888
Other changes, net 27 (2) 17
Provision for credit losses 2,811 1,445 448
Loans and leases charged-off (1,862) (917) (405)
Recoveries of previous charge-offs 89 66 67
Net loans and leases charged-off (1,773) (851) (338)
Ending Balance $ 2,672 $1,607 $1,015
Allowance for loan and lease losses $ 2,600 1,574 1,004
Reserve for unfunded lending commitments 72 33 11
Allowance for credit losses $ 2,672 $1,607 $1,015
For the Years Ended
December 31,
2009 2008 2007
(Dollars in millions)
Nonaccrual loans and leases (1) $ 2,718 $1,413 $ 502
Foreclosed real estate 1,451 538 143
Other foreclosed property 58 79 51
Total foreclosed property 1,509 617 194
Total nonperforming assets (excluding covered assets) (2) $ 4,227 $2,030 $ 696
Loans 90 days or more past due and still accruing (3)(4) $ 319 $ 431 $ 223
(1) Covered and other acquired loans are considered to be performing due to the application of the accretion
method. Covered loans that are contractually past due are noted in footnote 4 below.
(2) Excludes foreclosed real estate totaling $160 million as of December 31, 2009 that is covered by FDIC loss
sharing agreements.
(3) Excludes mortgage loans guaranteed by GNMA that BB&T does not have the obligation to repurchase.
(4) Excludes loans totaling $1.4 billion past due 90 days or more at December 31, 2009 that are covered by FDIC
loss sharing agreements.
The gross additional interest income that would have been earned if the loans and leases classified as
nonaccrual had performed in accordance with the original terms was approximately $115 million, $69 million and
$30 million in 2009, 2008 and 2007, respectively.
115