BB&T 2009 Annual Report Download - page 53
Download and view the complete annual report
Please find page 53 of the 2009 BB&T annual report below. You can navigate through the pages in the report by either clicking on the pages listed below, or by using the keyword search tool below to find specific information within the annual report.-
 1
1 -
2
-
3
-
4
-
5
-
6
-
7
-
8
-
9
-
10
-
11
-
12
-
13
-
14
-
15
-
16
-
17
-
18
-
19
-
20
-
21
-
22
-
23
-
24
-
25
-
26
-
27
-
28
-
29
-
30
-
31
-
32
-
33
-
34
-
35
-
36
-
37
-
38
-
39
-
40
-
41
-
42
-
 43
43 -
 44
44 -
 45
45 -
 46
46 -
 47
47 -
 48
48 -
 49
49 -
 50
50 -
 51
51 -
 52
52 -
 53
53 -
 54
54 -
 55
55 -
 56
56 -
 57
57 -
 58
58 -
 59
59 -
 60
60 -
 61
61 -
 62
62 -
 63
63 -
64
-
65
-
66
-
67
-
68
-
69
-
70
-
71
-
72
-
73
-
74
-
75
-
76
-
77
-
78
-
79
-
80
-
81
-
82
-
83
-
84
-
85
-
86
-
87
-
88
-
89
-
90
-
91
-
92
-
93
-
94
-
95
-
96
-
97
-
98
-
99
-
100
-
101
-
102
-
103
-
104
-
105
-
106
-
107
-
108
-
109
-
110
-
111
-
112
-
113
-
114
-
115
-
116
-
117
-
118
-
119
-
120
-
121
-
122
-
123
-
124
-
125
-
126
-
127
-
128
-
129
-
130
-
131
-
132
-
133
-
134
-
135
-
136
-
137
-
138
-
139
-
140
-
141
-
142
-
143
-
144
-
145
-
146
-
147
-
148
-
149
-
150
-
151
-
152
-
153
-
154
-
155
-
156
-
157
-
158
-
159
-
160
-
161
-
162
-
163
-
164
-
165
-
166
-
167
-
168
-
169
-
170
 |
 |

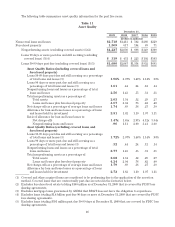
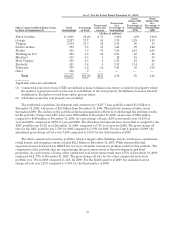
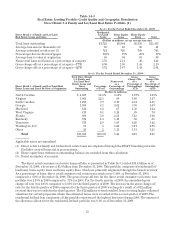
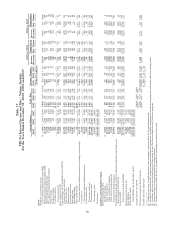
As of / For the Period Ended December 31, 2009
Other Commercial Real Estate Loans
by State of Origination (2) Total
Outstandings Percentage
of Total
Nonaccrual
Loans and
Leases
Nonaccrual
as a
Percentage of
Outstandings
Gross
Charge-Offs
as a
Percentage of
Outstandings
- YTD
Gross
Charge-Offs
as a
Percentage of
Outstandings
-QTD
(Dollars in millions)
North Carolina $ 3,801 30.4% $ 75 1.96% .49% 1.08%
Georgia 2,207 17.7 84 3.79 1.29 1.83
Virginia 1,914 15.3 25 1.30 .06 .10
South Carolina 970 7.8 33 3.45 .70 1.26
Florida 943 7.6 73 7.80 2.81 4.36
Washington, D.C. 705 5.6 16 2.33 .40 .28
Maryland 535 4.3 1 .12 .15 .39
West Virginia 470 3.8 8 1.73 .27 .49
Kentucky 421 3.4 8 1.91 1.14 .41
Tennessee 399 3.2 14 3.49 .93 1.35
Other 112 .9 — — — —
Total $12,477 100.0% $337 2.70 .76 1.21
Applicable ratios are annualized.
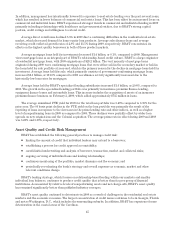
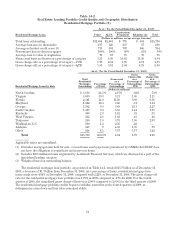
(1) Commercial real estate loans (CRE) are defined as loans to finance non-owner occupied real property where
the primary repayment source is the sale or rental/lease of the real property. Definition is based on internal
classification. Excludes covered loans and in process items.
(2) C&I loans secured by real property are excluded.
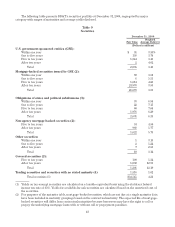
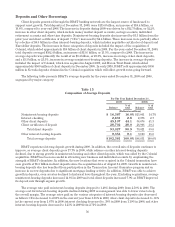
The residential acquisition, development and construction (“ADC”) loan portfolio totaled $5.8 billion at
December 31, 2009, a decrease of $2.2 billion from December 31, 2008. This portfolio remained under stress
throughout 2009. The decline in the portfolio reflects management’s efforts to work through the problem credits
in this portfolio. Nonaccrual ADC loans were $785 million at December 31, 2009, an increase of $285 million,
compared to $500 million at December 31, 2008. As a percentage of loans, ADC nonaccruals were 13.63% at
year-end 2009, compared to 6.27% at year-end 2008. The allowance for loan and lease losses that is assigned to the
ADC portfolio was 14.1% as of December 31, 2009, compared to 7.7% as of year-end 2008. The gross charge-off
rate for the ADC portfolio was 5.71% for 2009 compared to 1.83% for 2008. For the fourth quarter of 2009, the
annualized gross charge-off rate was 7.40% compared to 6.35% for the third quarter of 2009.
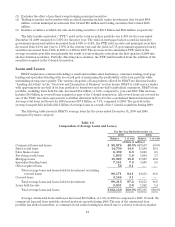
The other commercial real estate portfolio, which is largely office buildings, hotels, warehouses, apartments,
rental houses, and shopping centers, totaled $12.5 billion at December 31, 2009. While this portfolio has
experienced some deterioration, BB&T has not seen a dramatic increase in problem credits in this portfolio. The
components of the portfolio that are experiencing the most stress relate to land development and hotel
properties. As a percentage of loans, other commercial real estate nonaccruals were 2.70% at December 31, 2009,
compared with .97% at December 31, 2008. The gross charge-off rate for the other commercial real estate
portfolio was .76% in 2009 compared to .25% for 2008. For the fourth quarter of 2009, the annualized gross
charge-off rate was 1.21% compared to 1.00% for the third quarter of 2009.
53