BB&T 2009 Annual Report Download - page 52
Download and view the complete annual report
Please find page 52 of the 2009 BB&T annual report below. You can navigate through the pages in the report by either clicking on the pages listed below, or by using the keyword search tool below to find specific information within the annual report.-
 1
1 -
2
-
3
-
4
-
5
-
6
-
7
-
8
-
9
-
10
-
11
-
12
-
13
-
14
-
15
-
16
-
17
-
18
-
19
-
20
-
21
-
22
-
23
-
24
-
25
-
26
-
27
-
28
-
29
-
30
-
31
-
32
-
33
-
34
-
35
-
36
-
37
-
38
-
39
-
40
-
41
-
 42
42 -
 43
43 -
 44
44 -
 45
45 -
 46
46 -
 47
47 -
 48
48 -
 49
49 -
 50
50 -
 51
51 -
 52
52 -
 53
53 -
 54
54 -
 55
55 -
 56
56 -
 57
57 -
 58
58 -
 59
59 -
 60
60 -
 61
61 -
 62
62 -
63
-
64
-
65
-
66
-
67
-
68
-
69
-
70
-
71
-
72
-
73
-
74
-
75
-
76
-
77
-
78
-
79
-
80
-
81
-
82
-
83
-
84
-
85
-
86
-
87
-
88
-
89
-
90
-
91
-
92
-
93
-
94
-
95
-
96
-
97
-
98
-
99
-
100
-
101
-
102
-
103
-
104
-
105
-
106
-
107
-
108
-
109
-
110
-
111
-
112
-
113
-
114
-
115
-
116
-
117
-
118
-
119
-
120
-
121
-
122
-
123
-
124
-
125
-
126
-
127
-
128
-
129
-
130
-
131
-
132
-
133
-
134
-
135
-
136
-
137
-
138
-
139
-
140
-
141
-
142
-
143
-
144
-
145
-
146
-
147
-
148
-
149
-
150
-
151
-
152
-
153
-
154
-
155
-
156
-
157
-
158
-
159
-
160
-
161
-
162
-
163
-
164
-
165
-
166
-
167
-
168
-
169
-
170
 |
 |

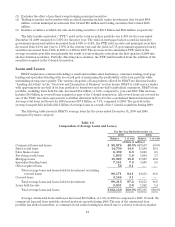
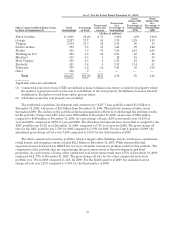
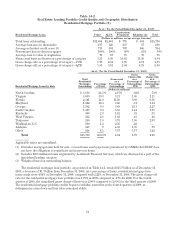
The following tables provide further details regarding BB&T’s commercial real estate lending, residential
mortgage and consumer home equity portfolios as of December 31, 2009.
Table 14-1
Real Estate Lending Portfolio Credit Quality and Geographic Distribution
Commercial Real Estate Loan Portfolio (1)
As of / For the Period Ended December 31, 2009
Residential Acquisition, Development, and Construction
Loans (ADC) Builder /
Construction Land /Land
Development Condos /
Townhomes Total ADC
(Dollars in millions, except average loan and average client size)
Total loans outstanding $1,663 $3,741 $ 357 $5,761
Average loan size (in thousands) 260 584 1,433 442
Average client size (in thousands) 603 1,035 2,587 884
Nonaccrual loans and leases as a percentage of
category 14.93% 12.83% 15.92% 13.63%
Gross charge-offs as a percentage of category—YTD 4.85 6.33 4.42 5.71
Gross charge-offs as a percentage of category—QTD 5.46 7.83 11.96 7.40
As of / For the Period Ended December 31, 2009
Residential Acquisition, Development,
and Construction Loans (ADC) by State
of Origination Total
Outstandings Percentage
of Total
Nonaccrual
Loans and
Leases
Nonaccrual
as a
Percentage of
Outstandings
Gross
Charge-Offs
as a
Percentage of
Outstandings
- YTD
Gross
Charge-Offs
as a
Percentage of
Outstandings
-QTD
(Dollars in millions)
North Carolina $2,313 40.2% $186 8.04% 1.99% 2.64%
Virginia 898 15.6 69 7.73 3.74 3.13
Georgia 747 13.0 183 24.53 14.20 20.24
South Carolina 554 9.6 110 19.85 6.22 9.60
Florida 490 8.5 124 25.18 12.44 16.91
Washington, D.C. 209 3.6 39 18.78 1.13 .12
Tennessee 174 3.0 32 18.54 4.98 9.47
Kentucky 166 2.9 16 9.59 4.79 7.94
West Virginia 129 2.2 23 17.61 6.52 9.06
Maryland 81 1.4 3 3.75 1.06 1.56
Total $5,761 100.0% $785 13.63 5.71 7.40
As of / For the Period Ended December 31, 2009
Other Commercial Real Estate Loans (2) Commercial
Construction
Commercial
Land/
Development
Permanent
Income
Producing
Properties
Total Other
Commercial
Real Estate
(Dollars in millions, except average loan and average client size)
Total loans outstanding $1,213 $2,043 $9,221 $12,477
Average loan size (in thousands) 1,142 729 490 550
Average client size (in thousands) 1,705 868 738 801
Nonaccrual loans and leases as a percentage of category 2.04% 5.09% 2.26% 2.70%
Gross charge-offs as a percentage of category—YTD .17 1.83 .58 .76
Gross charge-offs as a percentage of category—QTD .35 3.42 .81 1.21
52