BB&T 2009 Annual Report Download - page 118
Download and view the complete annual report
Please find page 118 of the 2009 BB&T annual report below. You can navigate through the pages in the report by either clicking on the pages listed below, or by using the keyword search tool below to find specific information within the annual report.-
 1
1 -
2
-
3
-
4
-
5
-
6
-
7
-
8
-
9
-
10
-
11
-
12
-
13
-
14
-
15
-
16
-
17
-
18
-
19
-
20
-
21
-
22
-
23
-
24
-
25
-
26
-
27
-
28
-
29
-
30
-
31
-
32
-
33
-
34
-
35
-
36
-
37
-
38
-
39
-
40
-
41
-
42
-
43
-
44
-
45
-
46
-
47
-
48
-
49
-
50
-
51
-
52
-
53
-
54
-
55
-
56
-
57
-
58
-
59
-
60
-
61
-
62
-
63
-
64
-
65
-
66
-
67
-
68
-
69
-
70
-
71
-
72
-
73
-
74
-
75
-
76
-
77
-
78
-
79
-
80
-
81
-
82
-
83
-
84
-
85
-
86
-
87
-
88
-
89
-
90
-
91
-
92
-
93
-
94
-
95
-
96
-
97
-
98
-
99
-
100
-
101
-
102
-
103
-
104
-
105
-
106
-
107
-
 108
108 -
 109
109 -
 110
110 -
 111
111 -
 112
112 -
 113
113 -
 114
114 -
 115
115 -
 116
116 -
 117
117 -
 118
118 -
 119
119 -
 120
120 -
 121
121 -
 122
122 -
 123
123 -
 124
124 -
 125
125 -
 126
126 -
 127
127 -
 128
128 -
129
-
130
-
131
-
132
-
133
-
134
-
135
-
136
-
137
-
138
-
139
-
140
-
141
-
142
-
143
-
144
-
145
-
146
-
147
-
148
-
149
-
150
-
151
-
152
-
153
-
154
-
155
-
156
-
157
-
158
-
159
-
160
-
161
-
162
-
163
-
164
-
165
-
166
-
167
-
168
-
169
-
170
 |
 |

BB&T CORPORATION AND SUBSIDIARIES
NOTES TO CONSOLIDATED FINANCIAL STATEMENTS—(Continued)
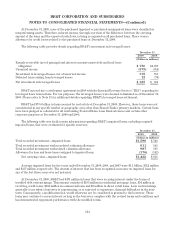
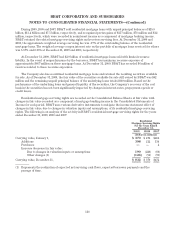
During 2009, 2008 and 2007, BB&T sold residential mortgage loans with unpaid principal balances of $25.8
billion, $13.4 billion and $7.5 billion, respectively, and recognized pretax gains of $357 million, $78 million and $12
million, respectively, which were recorded in noninterest income as a component of mortgage banking income.
BB&T retained the related mortgage servicing rights and receives servicing fees. At December 31, 2009 and
2008, the approximate weighted average servicing fee was .37% of the outstanding balance of the residential
mortgage loans. The weighted average coupon interest rate on the portfolio of mortgage loans serviced for others
was 5.57% and 6.03% at December 31, 2009 and 2008, respectively.
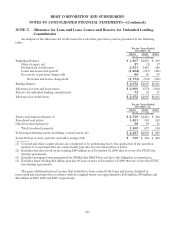
At December 31, 2009, BB&T had $2.0 billion of residential mortgage loans sold with limited recourse
liability. In the event of nonperformance by the borrower, BB&T has maximum recourse exposure of
approximately $667 million on these mortgage loans. At December 31, 2009, BB&T has recorded $6 million of
reserves related to these recourse exposures.
The Company also has securitized residential mortgage loans and retained the resulting securities available
for sale. As of December 31, 2009, the fair value of the securities available for sale still owned by BB&T was $62
million and the remaining unpaid principal balance of the underlying loans totaled $60 million. Based on the
performance of the underlying loans and general liquidity of the securities, the Company’s recovery of the cost
basis in the securities has not been significantly impacted by changes in interest rates, prepayment speeds or
credit losses.
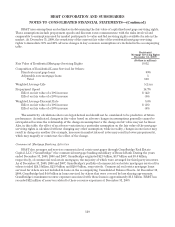
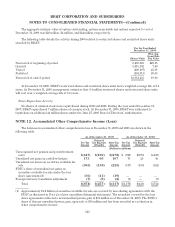
Residential mortgage servicing rights are recorded on the Consolidated Balance Sheets at fair value with
changes in fair value recorded as a component of mortgage banking income in the Consolidated Statements of
Income for each period. BB&T uses various derivative instruments to mitigate the income statement effect of
changes in fair value, due to changes in valuation inputs and assumptions, of its residential mortgage servicing
rights. The following is an analysis of the activity in BB&T’s residential mortgage servicing rights for the years
ended December 31, 2009, 2008 and 2007:
Residential
Mortgage Servicing Rights
For the Years Ended
December 31,
2009 2008 2007
(Dollars in millions)
Carrying value, January 1, $ 370 $ 472 $484
Additions 398 212 134
Purchases ——4
Increase (decrease) in fair value:
Due to changes in valuation inputs or assumptions 190 (220) (60)
Other changes (1) (126) (94) (90)
Carrying value, December 31, $ 832 $ 370 $472
(1) Represents the realization of expected net servicing cash flows, expected borrower payments and the
passage of time.
118