BB&T 2009 Annual Report Download - page 65
Download and view the complete annual report
Please find page 65 of the 2009 BB&T annual report below. You can navigate through the pages in the report by either clicking on the pages listed below, or by using the keyword search tool below to find specific information within the annual report.-
 1
1 -
2
-
3
-
4
-
5
-
6
-
7
-
8
-
9
-
10
-
11
-
12
-
13
-
14
-
15
-
16
-
17
-
18
-
19
-
20
-
21
-
22
-
23
-
24
-
25
-
26
-
27
-
28
-
29
-
30
-
31
-
32
-
33
-
34
-
35
-
36
-
37
-
38
-
39
-
40
-
41
-
42
-
43
-
44
-
45
-
46
-
47
-
48
-
49
-
50
-
51
-
52
-
53
-
54
-
 55
55 -
 56
56 -
 57
57 -
 58
58 -
 59
59 -
 60
60 -
 61
61 -
 62
62 -
 63
63 -
 64
64 -
 65
65 -
 66
66 -
 67
67 -
 68
68 -
 69
69 -
 70
70 -
 71
71 -
 72
72 -
 73
73 -
 74
74 -
 75
75 -
76
-
77
-
78
-
79
-
80
-
81
-
82
-
83
-
84
-
85
-
86
-
87
-
88
-
89
-
90
-
91
-
92
-
93
-
94
-
95
-
96
-
97
-
98
-
99
-
100
-
101
-
102
-
103
-
104
-
105
-
106
-
107
-
108
-
109
-
110
-
111
-
112
-
113
-
114
-
115
-
116
-
117
-
118
-
119
-
120
-
121
-
122
-
123
-
124
-
125
-
126
-
127
-
128
-
129
-
130
-
131
-
132
-
133
-
134
-
135
-
136
-
137
-
138
-
139
-
140
-
141
-
142
-
143
-
144
-
145
-
146
-
147
-
148
-
149
-
150
-
151
-
152
-
153
-
154
-
155
-
156
-
157
-
158
-
159
-
160
-
161
-
162
-
163
-
164
-
165
-
166
-
167
-
168
-
169
-
170
 |
 |

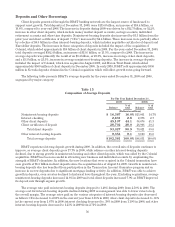
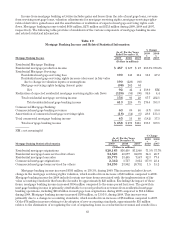
Noninterest Expense
Noninterest expense totaled $4.9 billion in 2009, $3.9 billion in 2008 and $3.6 billion in 2007. Noninterest expense
includes certain merger-related and restructuring charges recorded during the years 2009, 2008 and 2007 as noted in
Table 21 below. These amounts totaled $38 million in 2009, $15 million in 2008 and $21 million in 2007. Additional
disclosures related to these merger-related and restructuring charges are presented in “Merger-Related and
Restructuring Charges.” The table below shows the components of noninterest expense and the discussion that
follows explains the composition of certain categories and the factors that caused them to change in 2009 and 2008.
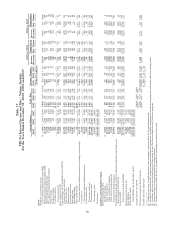
Table 20
Noninterest Expense
Years Ended December 31,
% Change
2009
v.
2008
2008
v.
20072009 2008 2007
(Dollars in millions)
Salaries and wages $2,000 $1,863 $1,715 7.4% 8.6%
Pension and other employee benefits 517 338 379 53.0 (10.8)
Total personnel expenses 2,517 2,201 2,094 14.4 5.1
Net occupancy expense on bank premises 366 310 286 18.1 8.4
Furniture and equipment expense 213 199 191 7.0 4.2
Total occupancy and equipment expenses 579 509 477 13.8 6.7
Foreclosed property expense 356 79 31 NM 154.8
Professional services 262 204 139 28.4 46.8
Regulatory charges 230 30 14 NM 114.3
Loan processing expenses 135 125 111 8.0 12.6
Amortization of intangibles 114 100 104 14.0 (3.8)
Software 94 74 58 27.0 27.6
Operational losses 60 17 36 NM (52.8)
Deposit related expense 53 49 43 8.2 14.0
Telephone 47 42 43 11.9 (2.3)
Travel and transportation 39 52 52 (25.0) —
Supplies 35 40 38 (12.5) 5.3
Other marketing expense 33 46 46 (28.3) —
Advertising and public relations 31 50 45 (38.0) 11.1
Merger-related and restructuring charges, net 38 15 21 153.3 (28.6)
Other noninterest expenses 308 278 272 10.8 2.2
Total noninterest expense $4,931 $3,911 $3,624 26.1 7.9
NM—not meaningful
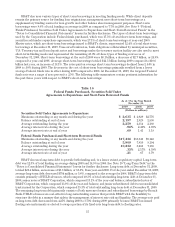
The 26.1% and 7.9% increases in total noninterest expense during 2009 and 2008 were primarily due to
increases in personnel costs, foreclosed property expense and professional services. In addition, 2009 reflects a
significant increase in regulatory charges as a result of increased FDIC insurance premiums. The increases
during 2009 and 2008 were impacted by the acquisitions of Colonial during 2009 and AFCO and Coastal during
2007 and several nonbank financial services companies during 2007 through 2009.
Total personnel expense is the largest component of noninterest expense and includes salaries and wages, as
well as pension and other employee benefit costs. Total personnel expense increased $316 million, or 14.4%, in
2009. This increase was partially driven by increases in salaries and wages of $137 million which includes the
impact of acquisitions. Other post-employment benefits expense and pension plan expense also increased $67
million and $66 million, respectively. The increase in pension expense was largely the result of a reduction in the
discount rate and a decline the value of plan assets, whereas the increase in other post employment benefits
expense was due to increases in the value of participant’s accounts and was offset by a similar increase in
noninterest income. In addition, health care and other welfare expenses were higher by $36 million.
65