BB&T 2009 Annual Report Download - page 117
Download and view the complete annual report
Please find page 117 of the 2009 BB&T annual report below. You can navigate through the pages in the report by either clicking on the pages listed below, or by using the keyword search tool below to find specific information within the annual report.-
 1
1 -
2
-
3
-
4
-
5
-
6
-
7
-
8
-
9
-
10
-
11
-
12
-
13
-
14
-
15
-
16
-
17
-
18
-
19
-
20
-
21
-
22
-
23
-
24
-
25
-
26
-
27
-
28
-
29
-
30
-
31
-
32
-
33
-
34
-
35
-
36
-
37
-
38
-
39
-
40
-
41
-
42
-
43
-
44
-
45
-
46
-
47
-
48
-
49
-
50
-
51
-
52
-
53
-
54
-
55
-
56
-
57
-
58
-
59
-
60
-
61
-
62
-
63
-
64
-
65
-
66
-
67
-
68
-
69
-
70
-
71
-
72
-
73
-
74
-
75
-
76
-
77
-
78
-
79
-
80
-
81
-
82
-
83
-
84
-
85
-
86
-
87
-
88
-
89
-
90
-
91
-
92
-
93
-
94
-
95
-
96
-
97
-
98
-
99
-
100
-
101
-
102
-
103
-
104
-
105
-
106
-
 107
107 -
 108
108 -
 109
109 -
 110
110 -
 111
111 -
 112
112 -
 113
113 -
 114
114 -
 115
115 -
 116
116 -
 117
117 -
 118
118 -
 119
119 -
 120
120 -
 121
121 -
 122
122 -
 123
123 -
 124
124 -
 125
125 -
 126
126 -
 127
127 -
128
-
129
-
130
-
131
-
132
-
133
-
134
-
135
-
136
-
137
-
138
-
139
-
140
-
141
-
142
-
143
-
144
-
145
-
146
-
147
-
148
-
149
-
150
-
151
-
152
-
153
-
154
-
155
-
156
-
157
-
158
-
159
-
160
-
161
-
162
-
163
-
164
-
165
-
166
-
167
-
168
-
169
-
170
 |
 |

BB&T CORPORATION AND SUBSIDIARIES
NOTES TO CONSOLIDATED FINANCIAL STATEMENTS—(Continued)
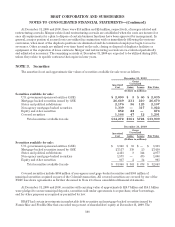
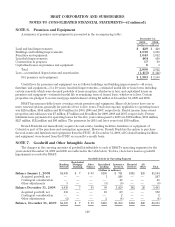
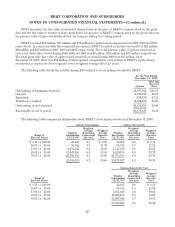
The following table presents the gross carrying amounts and accumulated amortization for BB&T’s
identifiable intangible assets subject to amortization at the dates presented:
Identifiable Intangible Assets
As of December 31, 2009 As of December 31, 2008
Gross
Carrying
Amount Accumulated
Amortization
Net
Carrying
Amount
Gross
Carrying
Amount Accumulated
Amortization
Net
Carrying
Amount
(Dollars in millions)
Identifiable intangible assets
Core deposit intangibles $ 633 $(375) $258 $ 457 $(325) $132
Other (1) 755 (373) 382 719 (309) 410
Totals $1,388 $(748) $640 $1,176 $(634) $542
(1) Other identifiable intangibles are primarily customer relationship intangibles.
During the years ended December 31, 2009, 2008 and 2007, BB&T incurred $114 million, $100 million and
$104 million, respectively, in pretax amortization expenses associated with core deposit intangibles and other
intangible assets. At December 31, 2009, the weighted-average remaining life of core deposit intangibles and
other identifiable intangibles was 9.7 years and 13.3 years, respectively.
Estimated amortization expense of identifiable intangible assets for each of the next five years total $125
million, $100 million, $82 million, $66 million and $53 million.
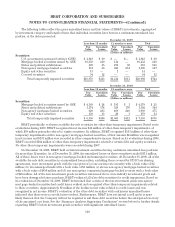
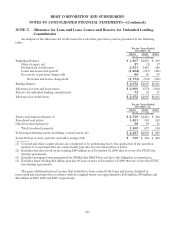
NOTE 8. Loan Servicing
Residential Mortgage Banking Activities
The following table includes a summary of residential mortgage loans managed or securitized and related
delinquencies and net charge-offs:
Years Ended December 31,
2009 2008
(Dollars in millions)
Mortgage Loans Managed or Securitized (1) $21,637 $21,477
Less: Loans Securitized and Transferred to Securities Available for Sale 60 573
Loans Held for Sale 2,524 1,343
Covered Mortgage Loans 1,632 —
Mortgage Loans Sold with Recourse 1,986 2,470
Mortgage Loans Held for Investment $15,435 $17,091
Mortgage Loans on Nonaccrual Status $ 767 $ 375
Mortgage Loans 90 Days Past Due and Still Accruing Interest 158 165
Mortgage Loan Net Charge-offs 275 95
(1) Balances exclude loans serviced for others, with no other continuing involvement.
The unpaid principal balances of BB&T’s total residential mortgage servicing portfolio were $73.6 billion,
$59.7 billion and $51.0 billion at December 31, 2009, 2008 and 2007, respectively. The unpaid principal balances of
residential mortgage loans serviced for others consist primarily of agency conforming fixed-rate mortgage loans
and totaled $54.5 billion, $40.7 billion and $32.1 billion at December 31, 2009, 2008 and 2007, respectively.
Mortgage loans serviced for others are not included in loans on the accompanying Consolidated Balance Sheets.
BB&T recognized servicing fees of $190 million, $145 million and $114 million during 2009, 2008 and 2007,
respectively, as a component of mortgage banking income.
117