BB&T 2009 Annual Report Download - page 55
Download and view the complete annual report
Please find page 55 of the 2009 BB&T annual report below. You can navigate through the pages in the report by either clicking on the pages listed below, or by using the keyword search tool below to find specific information within the annual report.-
 1
1 -
2
-
3
-
4
-
5
-
6
-
7
-
8
-
9
-
10
-
11
-
12
-
13
-
14
-
15
-
16
-
17
-
18
-
19
-
20
-
21
-
22
-
23
-
24
-
25
-
26
-
27
-
28
-
29
-
30
-
31
-
32
-
33
-
34
-
35
-
36
-
37
-
38
-
39
-
40
-
41
-
42
-
43
-
44
-
 45
45 -
 46
46 -
 47
47 -
 48
48 -
 49
49 -
 50
50 -
 51
51 -
 52
52 -
 53
53 -
 54
54 -
 55
55 -
 56
56 -
 57
57 -
 58
58 -
 59
59 -
 60
60 -
 61
61 -
 62
62 -
 63
63 -
 64
64 -
 65
65 -
66
-
67
-
68
-
69
-
70
-
71
-
72
-
73
-
74
-
75
-
76
-
77
-
78
-
79
-
80
-
81
-
82
-
83
-
84
-
85
-
86
-
87
-
88
-
89
-
90
-
91
-
92
-
93
-
94
-
95
-
96
-
97
-
98
-
99
-
100
-
101
-
102
-
103
-
104
-
105
-
106
-
107
-
108
-
109
-
110
-
111
-
112
-
113
-
114
-
115
-
116
-
117
-
118
-
119
-
120
-
121
-
122
-
123
-
124
-
125
-
126
-
127
-
128
-
129
-
130
-
131
-
132
-
133
-
134
-
135
-
136
-
137
-
138
-
139
-
140
-
141
-
142
-
143
-
144
-
145
-
146
-
147
-
148
-
149
-
150
-
151
-
152
-
153
-
154
-
155
-
156
-
157
-
158
-
159
-
160
-
161
-
162
-
163
-
164
-
165
-
166
-
167
-
168
-
169
-
170
 |
 |

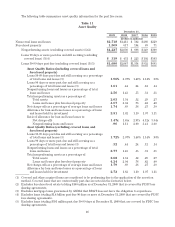
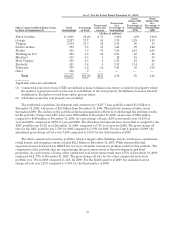
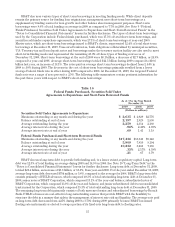
Table 14-3
Real Estate Lending Portfolio Credit Quality and Geographic Distribution
Direct Retail 1-4 Family and Lot/Land Real Estate Portfolio (1)
As of / For the Period Ended December 31, 2009
Direct Retail 1-4 Family and Lot/Land
Real Estate Loans and Lines
Residential
Lot/Land
Loans Home Equity
Loans Home Equity
Lines Total
(Dollars in millions, except average loan size)
Total loans outstanding $1,723 $5,984 $5,656 $13,363
Average loan size (in thousands) (2) 65 43 36 41
Average refreshed credit score (3) 721 720 760 743
Percentage that are first mortgages 100% 73% 26% 57%
Average loan to value at origination 80 64 65 66
Nonaccrual loans and leases as a percentage of category 5.78 1.11 .46 1.44
Gross charge-offs as a percentage of category—YTD 6.98 1.36 1.45 2.19
Gross charge-offs as a percentage of category—QTD 5.72 1.47 1.43 2.01
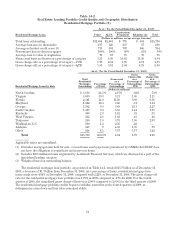
As of / For the Period Ended December 31, 2009
Direct Retail 1-4 Family and Lot/Land Real
Estate Loans and Lines By State of Origination
Total Direct Retail
1-4 Family and
Lot/Land Real
Estate Loans and
Lines
Outstanding Percentage
of Total
Nonaccrual
as a
Percentage of
Outstandings
Gross
Charge-Offs
as a
Percentage of
Outstandings
- YTD
Gross
Charge-Offs
as a
Percentage of
Outstandings
- QTD
(Dollars in millions)
North Carolina $ 4,607 34.5% 1.61% 1.87% 1.63%
Virginia 3,003 22.5 .69 1.46 1.47
South Carolina 1,293 9.7 2.19 2.31 2.11
Georgia 1,088 8.1 2.02 3.95 4.67
Maryland 832 6.2 .67 1.50 1.24
West Virginia 813 6.1 1.14 .89 .74
Florida 666 5.0 2.51 7.18 5.60
Kentucky 574 4.3 1.11 .50 .38
Tennessee 379 2.8 1.96 4.26 3.42
Washington, D.C. 85 .6 1.22 3.17 2.76
Other 23 .2 1.13 1.13 3.23
Total $13,363 100.0% 1.44 2.19 2.01
Applicable ratios are annualized.
(1) Direct retail 1-4 family and lot/land real estate loans are originated through the BB&T branching network.
Excludes covered loans and in process items.
(2) Home equity lines without an outstanding balance are excluded from this calculation.
(3) Based on number of accounts.
The direct retail consumer real estate loan portfolio, as presented in Table 14-3, totaled $13.4 billion as of
December 31, 2009, a decrease of $1.0 billion from December 31, 2008. This portfolio comprises of residential lot/
land loans, home equity loans and home equity lines, which are primarily originated through the branch network.
As a percentage of loans, direct retail consumer real estate nonaccruals were 1.44% at December 31, 2009,
compared to .60% at December 31, 2008. The gross charge-off rate for the direct retail consumer real estate loan
portfolio was 2.19% in 2009 compared to .71% for 2008. For the fourth quarter of 2009, the annualized gross
charge-off rate was 2.01% compared to 1.63% for the third quarter of 2009. The increase in the gross charge-off
rate for the fourth quarter of 2009 compared to the third quarter of 2009 was largely a result of a $12 million
reversal that was recorded in the third quarter. The $12 million reversal resulted from receiving higher collateral
valuations for certain properties where the estimated losses were recorded in the second quarter of 2009. The
residential lot/land loan component of this portfolio experienced the highest loss rates during 2009. The amount of
the allowance allocated for the residential lot/land portfolio was 8.1% as of December 31, 2009.
55