BB&T 2009 Annual Report Download - page 82
Download and view the complete annual report
Please find page 82 of the 2009 BB&T annual report below. You can navigate through the pages in the report by either clicking on the pages listed below, or by using the keyword search tool below to find specific information within the annual report.-
 1
1 -
2
-
3
-
4
-
5
-
6
-
7
-
8
-
9
-
10
-
11
-
12
-
13
-
14
-
15
-
16
-
17
-
18
-
19
-
20
-
21
-
22
-
23
-
24
-
25
-
26
-
27
-
28
-
29
-
30
-
31
-
32
-
33
-
34
-
35
-
36
-
37
-
38
-
39
-
40
-
41
-
42
-
43
-
44
-
45
-
46
-
47
-
48
-
49
-
50
-
51
-
52
-
53
-
54
-
55
-
56
-
57
-
58
-
59
-
60
-
61
-
62
-
63
-
64
-
65
-
66
-
67
-
68
-
69
-
70
-
71
-
 72
72 -
 73
73 -
 74
74 -
 75
75 -
 76
76 -
 77
77 -
 78
78 -
 79
79 -
 80
80 -
 81
81 -
 82
82 -
 83
83 -
 84
84 -
 85
85 -
 86
86 -
 87
87 -
 88
88 -
 89
89 -
 90
90 -
 91
91 -
 92
92 -
93
-
94
-
95
-
96
-
97
-
98
-
99
-
100
-
101
-
102
-
103
-
104
-
105
-
106
-
107
-
108
-
109
-
110
-
111
-
112
-
113
-
114
-
115
-
116
-
117
-
118
-
119
-
120
-
121
-
122
-
123
-
124
-
125
-
126
-
127
-
128
-
129
-
130
-
131
-
132
-
133
-
134
-
135
-
136
-
137
-
138
-
139
-
140
-
141
-
142
-
143
-
144
-
145
-
146
-
147
-
148
-
149
-
150
-
151
-
152
-
153
-
154
-
155
-
156
-
157
-
158
-
159
-
160
-
161
-
162
-
163
-
164
-
165
-
166
-
167
-
168
-
169
-
170
 |
 |
The economic provision for loan and lease losses of $90 million was up 125.0% in 2009 after a 90.5% increase to
$40 million in 2008. The increase in 2009 reflects higher loss rates and the current weak economic conditions.
The Sales Finance segment was assessed referral fees of $13 million in 2009 and 2008 to compensate the
Banking Network for services. Noninterest expenses incurred within the Sales Finance segment increased 10.7%
in 2009 after increasing 12.0% during 2008. Allocated corporate expense increased slightly in 2009 and 2008
compared to the previous years.
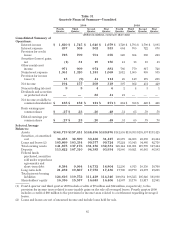
Total identifiable assets for the Sales Finance segment of $6.1 billion increased $14 million, or 0.2%, compared
to 2008 and $331 million, or 5.7%, from 2008 to 2007.
Specialized Lending
BB&T’s Specialized Lending segment continued to expand during 2009 through strong organic growth and
select asset portfolio purchases of certain high performing asset portfolios. Net income from the Specialized
Lending segment was $43 million for 2009, up 104.8% compared to 2008. The increase in net income was driven by
an asset purchase in insurance premium financing and improved credit performance in consumer auto lending, as
well as net interest margin expansion in those businesses. The equipment financing loan and lease portfolio also
experienced significant growth in 2009. Net income in 2008 was down $52 million, or 71.2%, compared to 2007
primarily due to a higher provision for credit losses.
Net interest income totaled $605 million in 2009, an increase of 20.8% compared to 2008. Comparing 2008 to
2007, net interest income increased $48 million, or 10.6%. The growth in net interest income in 2009 and 2008 was
a result of strong portfolio growth. Average loans for the Specialized Lending segment grew by $1.6 billion, or
29.6%, to $7.1 billion in 2009 compared to 2008. Average loan growth for the segment was $446 million, or 8.7%, in
2008 compared to 2007.
The economic provision for loan and lease losses totaled $332 million in 2009, an increase of $31 million
compared to 2008. Comparing 2008 to 2007, the economic provision for loan and lease losses increased $107
million, or 55.2%. The declining rate of growth in the provision for 2009 is primarily attributable to stabilization in
the sub-prime auto loan portfolio. Due to the overall higher credit risk profiles of some of the clients of Specialized
Lending, loss rates are expected to be higher than conventional bank lending. Loss rates are also affected by
shifts in the portfolio mix of the underlying subsidiaries.
Noninterest income produced by the Specialized Lending segment totaled $119 million in 2009, an increase of
$3 million, or 2.6%, compared to 2008. Comparing 2008 to 2007, noninterest income increased $26 million, or 28.9%.
Noninterest expenses incurred within the Specialized Lending segment in 2009 totaled $284 million, an increase
of $41 million, or 16.9%, compared to 2008. Comparing 2008 to 2007, noninterest expenses totaled $243 million, an
increase of $37 million, or 18.0%. The increases in noninterest expenses incurred within the Specialized Lending
segment were due to a combination of internal growth and growth from acquisitions.
Total identifiable assets for the Specialized Lending segment of $8.2 billion increased $1.6 billion, or 24.2%,
between 2008 and 2009 due primarily to internally-generated growth. Comparing 2008 to 2007, total identifiable
assets increased $1.0 billion.
Insurance Services
Net income from the Insurance Services segment increased $20 million, or 18.5%, in 2009 compared to 2008.
Both acquisition and organic growth have contributed to the growth of Insurance Services despite the ongoing
soft market conditions being experienced within the insurance industry. Comparing 2008 to 2007, net income
declined $17 million, or 13.6%. The 2007 results included a pre-tax gain of $19 million from the sale of an insurance
agency operation.
Noninterest income produced by the Insurance Services segment totaled $1.0 billion during 2009, an increase
of $125 million, or 13.8%, compared to 2008. Internal growth combined with the expansion of BB&T’s insurance
agency network and insurance brokerage operations were responsible for the growth in noninterest income.
82