BB&T 2009 Annual Report Download - page 84
Download and view the complete annual report
Please find page 84 of the 2009 BB&T annual report below. You can navigate through the pages in the report by either clicking on the pages listed below, or by using the keyword search tool below to find specific information within the annual report.-
 1
1 -
2
-
3
-
4
-
5
-
6
-
7
-
8
-
9
-
10
-
11
-
12
-
13
-
14
-
15
-
16
-
17
-
18
-
19
-
20
-
21
-
22
-
23
-
24
-
25
-
26
-
27
-
28
-
29
-
30
-
31
-
32
-
33
-
34
-
35
-
36
-
37
-
38
-
39
-
40
-
41
-
42
-
43
-
44
-
45
-
46
-
47
-
48
-
49
-
50
-
51
-
52
-
53
-
54
-
55
-
56
-
57
-
58
-
59
-
60
-
61
-
62
-
63
-
64
-
65
-
66
-
67
-
68
-
69
-
70
-
71
-
72
-
73
-
 74
74 -
 75
75 -
 76
76 -
 77
77 -
 78
78 -
 79
79 -
 80
80 -
 81
81 -
 82
82 -
 83
83 -
 84
84 -
 85
85 -
 86
86 -
 87
87 -
 88
88 -
 89
89 -
 90
90 -
 91
91 -
 92
92 -
 93
93 -
 94
94 -
95
-
96
-
97
-
98
-
99
-
100
-
101
-
102
-
103
-
104
-
105
-
106
-
107
-
108
-
109
-
110
-
111
-
112
-
113
-
114
-
115
-
116
-
117
-
118
-
119
-
120
-
121
-
122
-
123
-
124
-
125
-
126
-
127
-
128
-
129
-
130
-
131
-
132
-
133
-
134
-
135
-
136
-
137
-
138
-
139
-
140
-
141
-
142
-
143
-
144
-
145
-
146
-
147
-
148
-
149
-
150
-
151
-
152
-
153
-
154
-
155
-
156
-
157
-
158
-
159
-
160
-
161
-
162
-
163
-
164
-
165
-
166
-
167
-
168
-
169
-
170
 |
 |
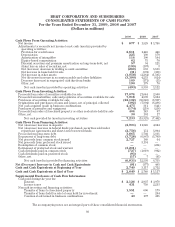
interest income for the Treasury segment consisted of $300 million of net interest income and $7 million of net
interest expense from the FTP charge.
During 2009, noninterest income earned by the Treasury segment totaled $326 million, an increase of 23.0%,
compared to $265 million earned during 2008. This increase in noninterest income during 2009 included $239
million in gains on the sale of securities. These gains were partially offset by other-than-temporary-impairment
(“OTTI”) write downs of $7 million. For 2008, net gains on the sale of securities totaled $233 million and OTTI was
$54 million. For 2007, noninterest income within the Treasury segment totaled $111 million.
The provision for income taxes allocated to the Treasury segment during 2009 was $28 million compared to
$161 million in 2008 and a benefit of $106 million in 2007. The changes in the taxes allocated to the Treasury
segment are a combination of changes in the level of pretax income and tax-exempt income.
As of December 31, 2009, total identifiable assets in the Treasury segment were $37.5 billion, a slight
increase from the prior year. This followed an increase of $13.3 billion, or 55.1%, in 2008 compared to 2007. This
increase in assets reflects the initial deployment of the capital invested by the U.S. Treasury as part of the
Capital Purchase Program.
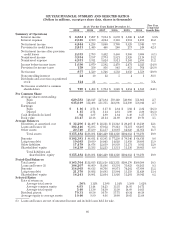
Fourth Quarter Results
Net income for the fourth quarter of 2009 was $194 million, compared to $307 million for the comparable
period of 2008. Diluted net income for the fourth quarter of 2009 was $.27 per common share compared to $.51 for
the same period a year ago. Annualized returns on average assets and average common equity were .47% and
4.52%, respectively, for the fourth quarter of 2009, compared to .86% and 8.47%, respectively, for the fourth
quarter of 2008.
Results for the fourth quarter of 2009 include a $27 million gain on the sale of payroll processing business, $9
million in loan revaluation adjustments related to the Colonial acquisition and $7 million in net income tax
adjustments. In addition, BB&T recorded $9 million of merger related and restructuring charges in the fourth
quarter of 2009 in connection with the acquisition of Colonial. Results for the fourth quarter of 2008 include $66
million in after-tax securities gains, $39 million in after-tax other-than-temporary impairment charges and $17
million in net after tax gains related to a settlement with the IRS in connection with leveraged lease transactions.
Net interest income amounted to $1.3 billion for the fourth quarter of 2009, an increase of 24.2% compared to
$1.1 billion for the same period of 2008. Noninterest income totaled $970 million for the fourth quarter of 2009, up
20.2% from $807 million earned during the fourth quarter of 2008. The growth in noninterest income in the fourth
quarter of 2009 compared to the same period of 2008 was driven by increases in mortgage banking income, service
charges on deposits, checkcard fees and other nondeposit fees and commissions. Noninterest income also
benefitted from a $38 million increase in the value of various financial assets isolated for the purpose of providing
post-employment benefits and the $27 million gain on the sale of payroll processing business mentioned above.
BB&T’s noninterest expense for the fourth quarter of 2009 totaled $1.4 billion, up 34.5% from the $1.0 billion
recorded in the fourth quarter of 2008. The increase in noninterest expense was largely due to increases of $115
million for foreclosed property, $34 million in FDIC insurance expense, $17 million from increased pension costs,
$38 million for post-employment benefits expense that are offset by additional noninterest income and
approximately $159 million of growth resulting from purchase acquisitions.
The fourth quarter 2009 provision for credit losses increased 37.3% to $725 million, compared to $528 million
for the fourth quarter of 2008. The increase in the provision for credit losses reflects the deterioration in the
credit quality of the loan portfolio that has resulted from the ongoing distressed residential real estate markets
and economic recession. The increase in the provision for credit losses also reflects higher net charge-offs in the
fourth quarter of 2009, compared to the fourth quarter of 2008.
The fourth quarter 2009 provision for income taxes totaled $13 million, a decrease of $12 million compared to
$25 million for the same period of 2008. The provision for income taxes declined as a result of lower pre-tax
income and the $7 million in income tax adjustments mentioned above.
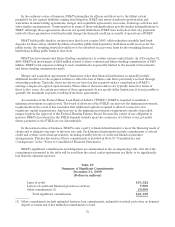
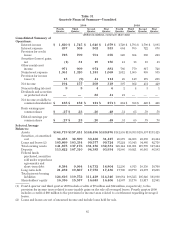
The accompanying table, “Quarterly Financial Summary—Unaudited,” presents condensed information
relating to quarterly periods in the years ended December 31, 2009 and 2008.
84