BB&T 2009 Annual Report Download - page 142
Download and view the complete annual report
Please find page 142 of the 2009 BB&T annual report below. You can navigate through the pages in the report by either clicking on the pages listed below, or by using the keyword search tool below to find specific information within the annual report.-
 1
1 -
2
-
3
-
4
-
5
-
6
-
7
-
8
-
9
-
10
-
11
-
12
-
13
-
14
-
15
-
16
-
17
-
18
-
19
-
20
-
21
-
22
-
23
-
24
-
25
-
26
-
27
-
28
-
29
-
30
-
31
-
32
-
33
-
34
-
35
-
36
-
37
-
38
-
39
-
40
-
41
-
42
-
43
-
44
-
45
-
46
-
47
-
48
-
49
-
50
-
51
-
52
-
53
-
54
-
55
-
56
-
57
-
58
-
59
-
60
-
61
-
62
-
63
-
64
-
65
-
66
-
67
-
68
-
69
-
70
-
71
-
72
-
73
-
74
-
75
-
76
-
77
-
78
-
79
-
80
-
81
-
82
-
83
-
84
-
85
-
86
-
87
-
88
-
89
-
90
-
91
-
92
-
93
-
94
-
95
-
96
-
97
-
98
-
99
-
100
-
101
-
102
-
103
-
104
-
105
-
106
-
107
-
108
-
109
-
110
-
111
-
112
-
113
-
114
-
115
-
116
-
117
-
118
-
119
-
120
-
121
-
122
-
123
-
124
-
125
-
126
-
127
-
128
-
129
-
130
-
131
-
 132
132 -
 133
133 -
 134
134 -
 135
135 -
 136
136 -
 137
137 -
 138
138 -
 139
139 -
 140
140 -
 141
141 -
 142
142 -
 143
143 -
 144
144 -
 145
145 -
 146
146 -
 147
147 -
 148
148 -
 149
149 -
 150
150 -
 151
151 -
 152
152 -
153
-
154
-
155
-
156
-
157
-
158
-
159
-
160
-
161
-
162
-
163
-
164
-
165
-
166
-
167
-
168
-
169
-
170
 |
 |

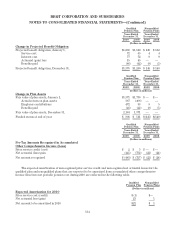
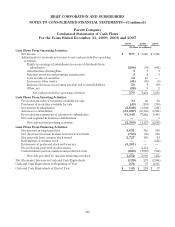
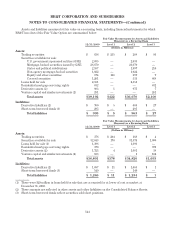
BB&T CORPORATION AND SUBSIDIARIES
NOTES TO CONSOLIDATED FINANCIAL STATEMENTS—(Continued)
Parent Company
Condensed Statements of Cash Flows
For the Years Ended December 31, 2009, 2008 and 2007
2009 2008 2007
(Dollars in millions)
Cash Flows From Operating Activities:
Net income $ 877 $ 1,529 $ 1,746
Adjustments to reconcile net income to net cash provided by operating
activities:
Equity in earnings of subsidiaries in excess of dividends from
subsidiaries (296) (94) (661)
Amortization of intangibles 333
Discount accretion and premium amortization 243
Loss on sales of securities 12 47 —
Increase in other assets (41) (38) (3)
Increase (decrease) in accounts payable and accrued liabilities 50 7 (39)
Other, net (28) 32
Net cash provided by operating activities 579 1,461 1,051
Cash Flows From Investing Activities:
Proceeds from sales of securities available for sale 33 62 32
Purchases of securities available for sale (43) (161) (136)
Investment in subsidiaries (2,608) (3,102) (101)
Advances to subsidiaries (61,087) (38,168) (3,984)
Proceeds from repayment of advances to subsidiaries 61,345 37,242 1,491
Net cash acquired in business combinations ——5
Net cash used in investing activities (2,360) (4,127) (2,693)
Cash Flows From Financing Activities:
Net increase in long-term debt 3,651 716 350
Net (decrease) increase in short-term borrowed funds (705) (88) 350
Net proceeds from common stock issued 2,727 160 64
Redemption of common stock —— (254)
Retirement of preferred stock and warrant (3,201) ——
Proceeds from preferred stock issuance —3,134 —
Cash dividends paid on common and preferred stock (820) (1,019) (962)
Net cash provided by (used in) financing activities 1,652 2,903 (452)
Net (Decrease) Increase in Cash and Cash Equivalents (129) 237 (2,094)
Cash and Cash Equivalents at Beginning of Year 274 37 2,131
Cash and Cash Equivalents at End of Year $ 145 $ 274 $ 37
142