BB&T 2009 Annual Report Download - page 141
Download and view the complete annual report
Please find page 141 of the 2009 BB&T annual report below. You can navigate through the pages in the report by either clicking on the pages listed below, or by using the keyword search tool below to find specific information within the annual report.-
 1
1 -
2
-
3
-
4
-
5
-
6
-
7
-
8
-
9
-
10
-
11
-
12
-
13
-
14
-
15
-
16
-
17
-
18
-
19
-
20
-
21
-
22
-
23
-
24
-
25
-
26
-
27
-
28
-
29
-
30
-
31
-
32
-
33
-
34
-
35
-
36
-
37
-
38
-
39
-
40
-
41
-
42
-
43
-
44
-
45
-
46
-
47
-
48
-
49
-
50
-
51
-
52
-
53
-
54
-
55
-
56
-
57
-
58
-
59
-
60
-
61
-
62
-
63
-
64
-
65
-
66
-
67
-
68
-
69
-
70
-
71
-
72
-
73
-
74
-
75
-
76
-
77
-
78
-
79
-
80
-
81
-
82
-
83
-
84
-
85
-
86
-
87
-
88
-
89
-
90
-
91
-
92
-
93
-
94
-
95
-
96
-
97
-
98
-
99
-
100
-
101
-
102
-
103
-
104
-
105
-
106
-
107
-
108
-
109
-
110
-
111
-
112
-
113
-
114
-
115
-
116
-
117
-
118
-
119
-
120
-
121
-
122
-
123
-
124
-
125
-
126
-
127
-
128
-
129
-
130
-
 131
131 -
 132
132 -
 133
133 -
 134
134 -
 135
135 -
 136
136 -
 137
137 -
 138
138 -
 139
139 -
 140
140 -
 141
141 -
 142
142 -
 143
143 -
 144
144 -
 145
145 -
 146
146 -
 147
147 -
 148
148 -
 149
149 -
 150
150 -
 151
151 -
152
-
153
-
154
-
155
-
156
-
157
-
158
-
159
-
160
-
161
-
162
-
163
-
164
-
165
-
166
-
167
-
168
-
169
-
170
 |
 |

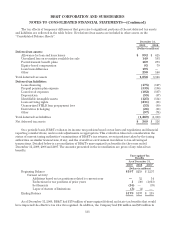
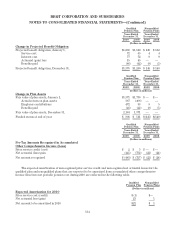
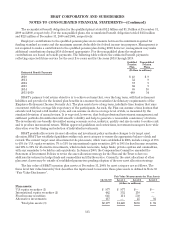
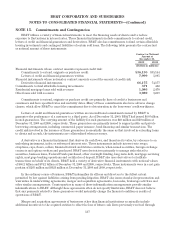
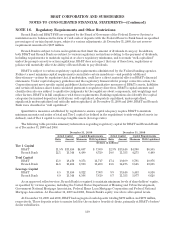
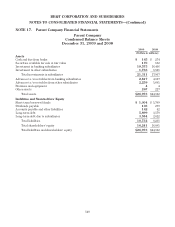
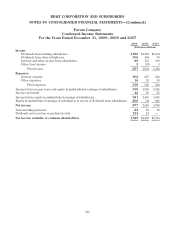
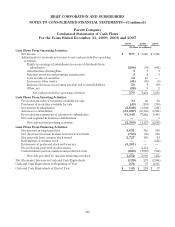
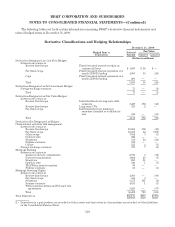
BB&T CORPORATION AND SUBSIDIARIES
NOTES TO CONSOLIDATED FINANCIAL STATEMENTS—(Continued)
Parent Company
Condensed Income Statements
For the Years Ended December 31, 2009, 2008 and 2007
2009 2008 2007
(Dollars in millions)
Income
Dividends from banking subsidiaries $459 $1,172 $1,184
Dividends from other subsidiaries 306 404 30
Interest and other income from subsidiaries 89 155 180
Other (loss) income 3(67) 8
Total income 857 1,664 1,402
Expenses
Interest expense 302 273 352
Other expenses 16 32 30
Total expenses 318 305 382
Income before income taxes and equity in undistributed earnings of subsidiaries 539 1,359 1,020
Income tax benefit 42 76 65
Income before equity in undistributed earnings of subsidiaries 581 1,435 1,085
Equity in undistributed earnings of subsidiaries in excess of dividends from subsidiaries 296 94 661
Net income 877 1,529 1,746
Noncontrolling interests 24 10 12
Dividends and accretion on preferred stock 124 21 —
Net income available to common shareholders $729 $1,498 $1,734
141