BB&T 2009 Annual Report Download - page 134
Download and view the complete annual report
Please find page 134 of the 2009 BB&T annual report below. You can navigate through the pages in the report by either clicking on the pages listed below, or by using the keyword search tool below to find specific information within the annual report.-
 1
1 -
2
-
3
-
4
-
5
-
6
-
7
-
8
-
9
-
10
-
11
-
12
-
13
-
14
-
15
-
16
-
17
-
18
-
19
-
20
-
21
-
22
-
23
-
24
-
25
-
26
-
27
-
28
-
29
-
30
-
31
-
32
-
33
-
34
-
35
-
36
-
37
-
38
-
39
-
40
-
41
-
42
-
43
-
44
-
45
-
46
-
47
-
48
-
49
-
50
-
51
-
52
-
53
-
54
-
55
-
56
-
57
-
58
-
59
-
60
-
61
-
62
-
63
-
64
-
65
-
66
-
67
-
68
-
69
-
70
-
71
-
72
-
73
-
74
-
75
-
76
-
77
-
78
-
79
-
80
-
81
-
82
-
83
-
84
-
85
-
86
-
87
-
88
-
89
-
90
-
91
-
92
-
93
-
94
-
95
-
96
-
97
-
98
-
99
-
100
-
101
-
102
-
103
-
104
-
105
-
106
-
107
-
108
-
109
-
110
-
111
-
112
-
113
-
114
-
115
-
116
-
117
-
118
-
119
-
120
-
121
-
122
-
123
-
 124
124 -
 125
125 -
 126
126 -
 127
127 -
 128
128 -
 129
129 -
 130
130 -
 131
131 -
 132
132 -
 133
133 -
 134
134 -
 135
135 -
 136
136 -
 137
137 -
 138
138 -
 139
139 -
 140
140 -
 141
141 -
 142
142 -
 143
143 -
 144
144 -
145
-
146
-
147
-
148
-
149
-
150
-
151
-
152
-
153
-
154
-
155
-
156
-
157
-
158
-
159
-
160
-
161
-
162
-
163
-
164
-
165
-
166
-
167
-
168
-
169
-
170
 |
 |

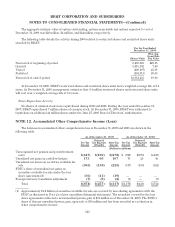
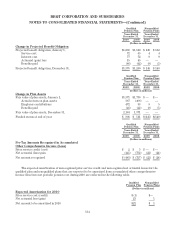
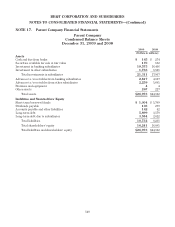
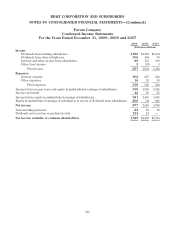
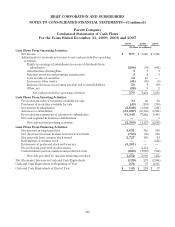
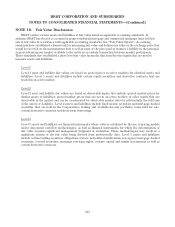
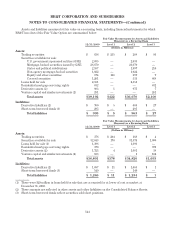
BB&T CORPORATION AND SUBSIDIARIES
NOTES TO CONSOLIDATED FINANCIAL STATEMENTS—(Continued)
Qualified
Pension Plan Nonqualified
Pension Plans
Years Ended
December 31, Years Ended
December 31,
2009 2008 2009 2008
(Dollars in millions)
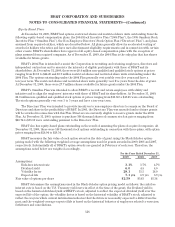
Change in Projected Benefit Obligation
Projected benefit obligation, January 1, $1,260 $1,120 $ 140 $ 132
Service cost 72 65 4 4
Interest cost 77 72 9 9
Actuarial (gain) loss 15 45 — —
Benefits paid (46) (42) (8) (5)
Projected benefit obligation, December 31, $1,378 $1,260 $ 145 $ 140
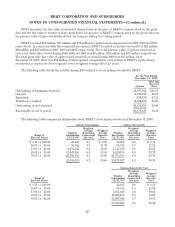
Qualified
Pension Plan Nonqualified
Pension Plans
Years Ended
December 31, Years Ended
December 31,
2009 2008 2009 2008
(Dollars in millions)
Change in Plan Assets
Fair value of plan assets, January 1, $1,371 $1,736 $ — $ —
Actual return on plan assets 387 (406) — —
Employer contributions 472 83 8 5
Benefits paid (46) (42) (8) (5)
Fair value of plan assets, December 31, 2,184 1,371 — —
Funded status at end of year $ 806 $ 111 $(145) $(140)
Qualified
Pension Plan Nonqualified
Pension Plans
Years Ended
December 31, Years Ended
December 31,
2009 2008 2009 2008
(Dollars in millions)
Pre-Tax Amounts Recognized in Accumulated
Other Comprehensive Income (Loss)
Prior service credit (cost) $ 2 $ 5 $ — $ —
Net actuarial (loss) gain (445) (732) (22) (24)
Net amount recognized $ (443) $ (727) $ (22) $ (24)
The expected amortization of unrecognized prior service credit and unrecognized net actuarial losses for the
qualified plan and nonqualified plans that are expected to be amortized from accumulated other comprehensive
income (loss) into net periodic pension cost during 2010 are reflected in the following table:
Qualified
Pension Plan Nonqualified
Pension Plans
(Dollars in millions)
Expected Amortization for 2010
Prior service cost (credit) $ (1) $—
Net actuarial loss (gain) 23 1
Net amount to be amortized in 2010 $22 $ 1
134