BB&T 2009 Annual Report Download - page 144
Download and view the complete annual report
Please find page 144 of the 2009 BB&T annual report below. You can navigate through the pages in the report by either clicking on the pages listed below, or by using the keyword search tool below to find specific information within the annual report.-
 1
1 -
2
-
3
-
4
-
5
-
6
-
7
-
8
-
9
-
10
-
11
-
12
-
13
-
14
-
15
-
16
-
17
-
18
-
19
-
20
-
21
-
22
-
23
-
24
-
25
-
26
-
27
-
28
-
29
-
30
-
31
-
32
-
33
-
34
-
35
-
36
-
37
-
38
-
39
-
40
-
41
-
42
-
43
-
44
-
45
-
46
-
47
-
48
-
49
-
50
-
51
-
52
-
53
-
54
-
55
-
56
-
57
-
58
-
59
-
60
-
61
-
62
-
63
-
64
-
65
-
66
-
67
-
68
-
69
-
70
-
71
-
72
-
73
-
74
-
75
-
76
-
77
-
78
-
79
-
80
-
81
-
82
-
83
-
84
-
85
-
86
-
87
-
88
-
89
-
90
-
91
-
92
-
93
-
94
-
95
-
96
-
97
-
98
-
99
-
100
-
101
-
102
-
103
-
104
-
105
-
106
-
107
-
108
-
109
-
110
-
111
-
112
-
113
-
114
-
115
-
116
-
117
-
118
-
119
-
120
-
121
-
122
-
123
-
124
-
125
-
126
-
127
-
128
-
129
-
130
-
131
-
132
-
133
-
 134
134 -
 135
135 -
 136
136 -
 137
137 -
 138
138 -
 139
139 -
 140
140 -
 141
141 -
 142
142 -
 143
143 -
 144
144 -
 145
145 -
 146
146 -
 147
147 -
 148
148 -
 149
149 -
 150
150 -
 151
151 -
 152
152 -
 153
153 -
 154
154 -
155
-
156
-
157
-
158
-
159
-
160
-
161
-
162
-
163
-
164
-
165
-
166
-
167
-
168
-
169
-
170
 |
 |

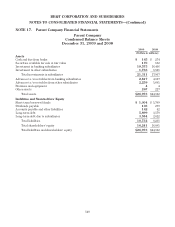
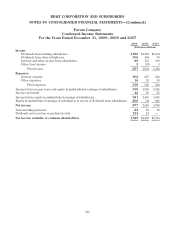
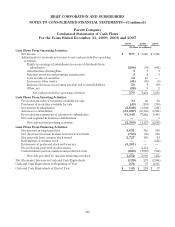
BB&T CORPORATION AND SUBSIDIARIES
NOTES TO CONSOLIDATED FINANCIAL STATEMENTS—(Continued)
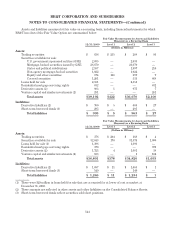
Assets and liabilities measured at fair value on a recurring basis, including financial instruments for which
BB&T has elected the Fair Value Option are summarized below:
12/31/2009
Fair Value Measurements for Assets and Liabilities
Measured on a Recurring Basis
Level 1 Level 2 Level 3
(Dollars in Millions)
Assets:
Trading securities $ 636 $ 255 $ 288 $ 93
Securities available for sale:
U.S. government-sponsored entities (GSE) 2,035 — 2,035 —
Mortgage-backed securities issued by GSE 26,670 — 26,670 —
States and political subdivisions 2,107 — 1,897 210
Non-agency mortgage-backed securities 1,022 — 1,022 —
Equity and other securities 874 166 699 9
Covered securities 1,201 — 533 668
Loans held for sale 2,551 — 2,551 —
Residential mortgage servicing rights 832 — — 832
Derivative assets (2) 983 1 975 7
Venture capital and similar investments (2) 281 — — 281
Total assets $39,192 $422 $36,670 $2,100
Liabilities:
Derivative liabilities (2) $ 700 $ 5 $ 668 $ 27
Short-term borrowed funds (3) 295 — 295 —
Total liabilities $ 995 $ 5 $ 963 $ 27
12/31/2008
Fair Value Measurements for Assets and Liabilities
Measured on a Recurring Basis
Level 1 Level 2 Level 3
(Dollars in Millions)
Assets:
Trading securities $ 376 $ 204 $ 168 $ 4
Securities available for sale 32,843 170 31,574 1,099
Loans held for sale (1) 1,396 — 1,396 —
Residential mortgage servicing rights 370 — — 370
Derivative assets (2) 1,723 4 1,681 38
Venture capital and similar investments (2) 183 — 1 182
Total assets $36,891 $378 $34,820 $1,693
Liabilities:
Derivative liabilities (2) $ 1,097 $ 11 $ 1,085 $ 1
Short-term borrowed funds (3) 149 — 149 —
Total liabilities $ 1,246 $ 11 $ 1,234 $ 1
(1) There were $28 million in loans held for sale that are accounted for at lower of cost or market at
December 31, 2008.
(2) These amounts are reflected in other assets and other liabilities on the Consolidated Balance Sheets.
(3) Short-term borrowed funds reflect securities sold short positions.
144