BB&T 2009 Annual Report Download - page 110
Download and view the complete annual report
Please find page 110 of the 2009 BB&T annual report below. You can navigate through the pages in the report by either clicking on the pages listed below, or by using the keyword search tool below to find specific information within the annual report.-
 1
1 -
2
-
3
-
4
-
5
-
6
-
7
-
8
-
9
-
10
-
11
-
12
-
13
-
14
-
15
-
16
-
17
-
18
-
19
-
20
-
21
-
22
-
23
-
24
-
25
-
26
-
27
-
28
-
29
-
30
-
31
-
32
-
33
-
34
-
35
-
36
-
37
-
38
-
39
-
40
-
41
-
42
-
43
-
44
-
45
-
46
-
47
-
48
-
49
-
50
-
51
-
52
-
53
-
54
-
55
-
56
-
57
-
58
-
59
-
60
-
61
-
62
-
63
-
64
-
65
-
66
-
67
-
68
-
69
-
70
-
71
-
72
-
73
-
74
-
75
-
76
-
77
-
78
-
79
-
80
-
81
-
82
-
83
-
84
-
85
-
86
-
87
-
88
-
89
-
90
-
91
-
92
-
93
-
94
-
95
-
96
-
97
-
98
-
99
-
 100
100 -
 101
101 -
 102
102 -
 103
103 -
 104
104 -
 105
105 -
 106
106 -
 107
107 -
 108
108 -
 109
109 -
 110
110 -
 111
111 -
 112
112 -
 113
113 -
 114
114 -
 115
115 -
 116
116 -
 117
117 -
 118
118 -
 119
119 -
 120
120 -
121
-
122
-
123
-
124
-
125
-
126
-
127
-
128
-
129
-
130
-
131
-
132
-
133
-
134
-
135
-
136
-
137
-
138
-
139
-
140
-
141
-
142
-
143
-
144
-
145
-
146
-
147
-
148
-
149
-
150
-
151
-
152
-
153
-
154
-
155
-
156
-
157
-
158
-
159
-
160
-
161
-
162
-
163
-
164
-
165
-
166
-
167
-
168
-
169
-
170
 |
 |

BB&T CORPORATION AND SUBSIDIARIES
NOTES TO CONSOLIDATED FINANCIAL STATEMENTS—(Continued)
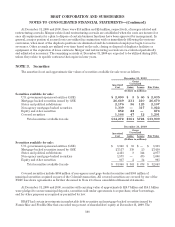
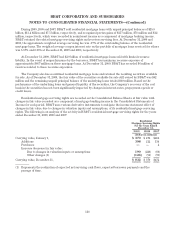
The following tables reflect the gross unrealized losses and fair values of BB&T’s investments, aggregated
by investment category and length of time that individual securities have been in a continuous unrealized loss
position, at the dates presented.
December 31, 2009
Less than 12 months 12 months or more Total
Fair
Value Unrealized
Losses Fair
Value Unrealized
Losses Fair
Value Unrealized
Losses
(Dollars in millions)
Securities:
U.S. government-sponsored entities (GSE) $ 1,843 $ 60 $ — $— $ 1,843 $ 60
Mortgage-backed securities issued by GSE 16,338 210 114 — 16,452 210
States and political subdivisions 409 65 274 60 683 125
Non-agency mortgage-backed securities 181 66 825 251 1,006 317
Equity and other securities 13 — 1 — 14 —
Covered securities 94 12 — — 94 12
Total temporarily impaired securities $18,878 $413 $1,214 $311 $20,092 $724
December 31, 2008
Less than 12 months 12 months or more Total
Fair
Value Unrealized
Losses Fair
Value Unrealized
Losses Fair
Value Unrealized
Losses
(Dollars in millions)
Securities:
Mortgage-backed securities issued by GSE $ 4,388 $ 24 $ 191 $ 1 $ 4,579 $ 25
States and political subdivisions 1,174 174 328 170 1,502 344
Non-agency mortgage-backed securities 629 235 469 240 1,098 475
Equity and other securities 159 33 20 1 179 34
Total temporarily impaired securities $ 6,350 $466 $1,008 $412 $ 7,358 $878
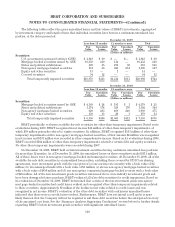
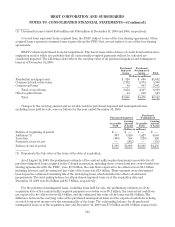
BB&T periodically evaluates available-for-sale securities for other-than-temporary impairment. Based on its
evaluations during 2009, BB&T recognized in net income $41 million of other-than-temporary impairments, of
which $39 million primarily related to equity securities. In addition, BB&T recognized $133 million of other-than-
temporary impairments on five non-agency mortgage-backed securities, of that amount $2 million was recognized
in net income and $131 million was recorded in other comprehensive income. Based on its evaluations during 2008,
BB&T recorded $104 million of other-than-temporary impairments related to certain debt and equity securities.
No other-than-temporary impairments were recorded during 2007.
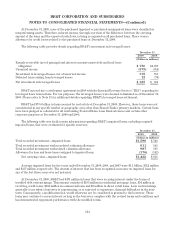
On December 31, 2009, BB&T held certain investment securities having continuous unrealized loss positions
for more than 12 months. As of December 31, 2009, the unrealized losses on these securities totaled $311 million.
All of these losses were in non-agency mortgage-backed and municipal securities. At December 31, 2009, all of the
available-for-sale debt securities in an unrealized loss position, excluding those covered by FDIC loss sharing
agreements, were investment grade with the exception of (a) one auction rate security with a book value of $2
million; (b) two municipal bonds with a book value of $8 million; (c) eleven non-agency mortgage-backed securities
with a book value of $859 million and (d) one non-agency commercial mortgage-backed security with a book value
of $25 million. All of the non-investment grade securities referenced above were initially investment grade and
have been downgraded since purchase. BB&T evaluated all of its debt securities for credit impairment. Based on
its evaluation at December 31, 2009, BB&T determined that certain of the non-investment grade non-agency
mortgage-backed securities had credit losses evident and recognized other-than-temporary impairments related
to these securities. Approximately $1 million of the decline in fair value related to credit losses and was
recognized in net income. BB&T’s evaluation of the other debt securities with continuous unrealized losses
indicated that there were no credit losses evident. Furthermore, BB&T does not intend to sell and it is more
likely than not that the Company will not be required to sell these debt securities before the anticipated recovery
of the amortized cost basis. See the “Summary Analysis Supporting Conclusions” section below for further details
regarding BB&T’s below investment grade securities with significant unrealized losses.
110