BB&T 2009 Annual Report Download - page 91
Download and view the complete annual report
Please find page 91 of the 2009 BB&T annual report below. You can navigate through the pages in the report by either clicking on the pages listed below, or by using the keyword search tool below to find specific information within the annual report.-
 1
1 -
2
-
3
-
4
-
5
-
6
-
7
-
8
-
9
-
10
-
11
-
12
-
13
-
14
-
15
-
16
-
17
-
18
-
19
-
20
-
21
-
22
-
23
-
24
-
25
-
26
-
27
-
28
-
29
-
30
-
31
-
32
-
33
-
34
-
35
-
36
-
37
-
38
-
39
-
40
-
41
-
42
-
43
-
44
-
45
-
46
-
47
-
48
-
49
-
50
-
51
-
52
-
53
-
54
-
55
-
56
-
57
-
58
-
59
-
60
-
61
-
62
-
63
-
64
-
65
-
66
-
67
-
68
-
69
-
70
-
71
-
72
-
73
-
74
-
75
-
76
-
77
-
78
-
79
-
80
-
 81
81 -
 82
82 -
 83
83 -
 84
84 -
 85
85 -
 86
86 -
 87
87 -
 88
88 -
 89
89 -
 90
90 -
 91
91 -
 92
92 -
 93
93 -
 94
94 -
 95
95 -
 96
96 -
 97
97 -
 98
98 -
 99
99 -
 100
100 -
 101
101 -
102
-
103
-
104
-
105
-
106
-
107
-
108
-
109
-
110
-
111
-
112
-
113
-
114
-
115
-
116
-
117
-
118
-
119
-
120
-
121
-
122
-
123
-
124
-
125
-
126
-
127
-
128
-
129
-
130
-
131
-
132
-
133
-
134
-
135
-
136
-
137
-
138
-
139
-
140
-
141
-
142
-
143
-
144
-
145
-
146
-
147
-
148
-
149
-
150
-
151
-
152
-
153
-
154
-
155
-
156
-
157
-
158
-
159
-
160
-
161
-
162
-
163
-
164
-
165
-
166
-
167
-
168
-
169
-
170
 |
 |

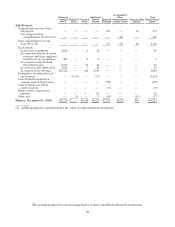
BB&T CORPORATION AND SUBSIDIARIES
CONSOLIDATED STATEMENTS OF CHANGES IN SHAREHOLDERS’ EQUITY
For the Years Ended December 31, 2009, 2008 and 2007
(Dollars in millions, except per share data, shares in thousands)
Shares of
Common
Stock Preferred
Stock Common
Stock
Additional
Paid-In
Capital Retained
Earnings
Accumulated
Other
Comprehensive
Income (Loss) Noncontrolling
Interest
Total
Shareholders’
Equity
Balance, January 1, 2007 541,475 $ — $2,707 $2,801 $ 6,596 $(359) $81 $11,826
Add (Deduct):
Comprehensive income (loss):
Net income — — — — 1,734 — 12 1,746
Net change in other
comprehensive income (loss) — — — — — 255 — 255
Total comprehensive income
(loss) (Note 12) — — — — 1,734 255 12 2,001
Stock issued:
In purchase acquisitions (1) 9,083 — 46 365 — — — 411
In connection with stock option
exercises and other employee
benefits, net of cancellations 2,397 — 12 52 — — — 64
Redemption of common stock (7,000) — (35) (219) — — — (254)
Cash dividends declared on
common stock, $1.80 per share — — — — (986) — — (986)
Cumulative effect of adoption of
accounting principles — — — — (425) — — (425)
Equity-based compensation
expense — — — 70 — — — 70
Other, net — — — 18 — — (61) (43)
Balance, December 31, 2007 545,955 — 2,730 3,087 6,919 (104) 32 12,664
Add (Deduct):
Comprehensive income (loss):
Net income — — — — 1,519 — 10 1,529
Net change in other
comprehensive income (loss) — — — — — (628) — (628)
Total comprehensive income
(loss) (Note 12) — — — — 1,519 (628) 10 901
Stock issued:
In purchase acquisitions 7,201 — 36 161 — — — 197
In connection with stock option
exercises and other employee
benefits, net of cancellations 2,219 — 11 52 — — — 63
In connection with dividend
reinvestment plan 1,415 — 7 37 — — — 44
In connection with private
placement to BB&T pension
plan 2,458 — 12 41 — — — 53
In connection with Capital
Purchase Program — 3,082 — — — — — 3,082
Warrants issued in connection
with Capital Purchase
Program — — — 52 — — — 52
Cash dividends declared on
common stock, $1.87 per share — — — — (1,028) — — (1,028)
Cash dividends accrued on
preferred stock — — — — (21) — — (21)
Cumulative effect of adoption of
accounting principles — — — — (8) — — (8)
Equity-based compensation
expense — — — 75 — — — 75
Other, net — — — 5 — — 2 7
Balance, December 31, 2008 559,248 3,082 2,796 3,510 7,381 (732) 44 16,081
91