BB&T 2009 Annual Report Download - page 54
Download and view the complete annual report
Please find page 54 of the 2009 BB&T annual report below. You can navigate through the pages in the report by either clicking on the pages listed below, or by using the keyword search tool below to find specific information within the annual report.-
 1
1 -
2
-
3
-
4
-
5
-
6
-
7
-
8
-
9
-
10
-
11
-
12
-
13
-
14
-
15
-
16
-
17
-
18
-
19
-
20
-
21
-
22
-
23
-
24
-
25
-
26
-
27
-
28
-
29
-
30
-
31
-
32
-
33
-
34
-
35
-
36
-
37
-
38
-
39
-
40
-
41
-
42
-
43
-
 44
44 -
 45
45 -
 46
46 -
 47
47 -
 48
48 -
 49
49 -
 50
50 -
 51
51 -
 52
52 -
 53
53 -
 54
54 -
 55
55 -
 56
56 -
 57
57 -
 58
58 -
 59
59 -
 60
60 -
 61
61 -
 62
62 -
 63
63 -
 64
64 -
65
-
66
-
67
-
68
-
69
-
70
-
71
-
72
-
73
-
74
-
75
-
76
-
77
-
78
-
79
-
80
-
81
-
82
-
83
-
84
-
85
-
86
-
87
-
88
-
89
-
90
-
91
-
92
-
93
-
94
-
95
-
96
-
97
-
98
-
99
-
100
-
101
-
102
-
103
-
104
-
105
-
106
-
107
-
108
-
109
-
110
-
111
-
112
-
113
-
114
-
115
-
116
-
117
-
118
-
119
-
120
-
121
-
122
-
123
-
124
-
125
-
126
-
127
-
128
-
129
-
130
-
131
-
132
-
133
-
134
-
135
-
136
-
137
-
138
-
139
-
140
-
141
-
142
-
143
-
144
-
145
-
146
-
147
-
148
-
149
-
150
-
151
-
152
-
153
-
154
-
155
-
156
-
157
-
158
-
159
-
160
-
161
-
162
-
163
-
164
-
165
-
166
-
167
-
168
-
169
-
170
 |
 |

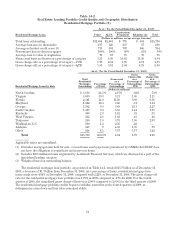
Table 14-2
Real Estate Lending Portfolio Credit Quality and Geographic Distribution
Residential Mortgage Portfolio (1)
As of / For the Period Ended December 31, 2009
Residential Mortgage Loans Prime ALT-A Construction/
Permanent Subprime (2) Total
(Dollars in millions, except average loan size)
Total loans outstanding $11,684 $2,684 $ 778 $ 584 $15,730
Average loan size (in thousands) 197 326 337 67 200
Average refreshed credit score (3) 713 694 707 566 704
Percentage that are first mortgages 100% 100% 99% 83% 99%
Average loan to value at origination 76 67 75 73 75
Nonaccrual loans and leases as a percentage of category 3.31 8.98 10.43 11.69 4.94
Gross charge-offs as a percentage of category—YTD 1.17 2.94 3.76 4.11 1.79
Gross charge-offs as a percentage of category—QTD 1.50 3.61 2.04 4.19 2.00
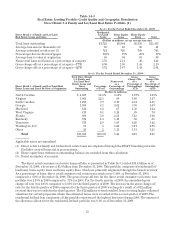
As of / For the Period Ended December 31, 2009
Residential Mortgage Loans by State
Total
Residential
Mortgages
Outstanding Percentage
of Total
Nonaccrual
as a
Percentage of
Outstandings
Gross
Charge-Offs
as a
Percentage of
Outstandings
- YTD
Gross
Charge-Offs
as a
Percentage of
Outstandings
- QTD
(Dollars in millions)
North Carolina $ 3,850 24.5% 2.87% .62% .72%
Virginia 3,039 19.3 3.21 1.30 1.11
Florida 2,341 14.9 11.08 5.69 6.56
Maryland 1,622 10.3 3.66 .81 1.14
Georgia 1,502 9.5 5.89 2.11 2.27
South Carolina 1,459 9.3 5.55 1.44 1.86
Kentucky 360 2.3 1.42 .33 .33
West Virginia 332 2.1 1.82 .45 .40
Tennessee 250 1.6 3.73 1.30 2.83
Washington, D.C. 190 1.2 2.56 .22 —
Alabama 147 .9 4.38 1.95 .70
Other 638 4.1 7.67 1.17 1.22
Total $15,730 100.0% 4.94 1.79 2.00
Applicable ratios are annualized.
(1) Excludes mortgage loans held for sale, covered loans, mortgage loans guaranteed by GNMA that BB&T does
not have the obligation to repurchase and in process items.
(2) Includes $365 million in loans originated by Lendmark Financial Services, which are disclosed as a part of the
specialized lending category.
(3) Weighted based on outstanding balance.
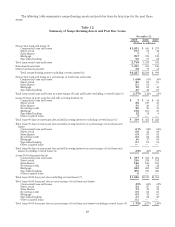
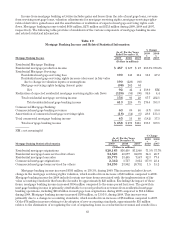
The residential mortgage loan portfolio, as presented in Table 14-2, totaled $15.7 billion as of December 31,
2009, a decrease of $1.7 billion from December 31, 2008. As a percentage of loans, residential mortgage loan
nonaccruals were 4.94% at December 31, 2009, compared with 2.22% at December 31, 2008. The gross charge-off
rate for the residential mortgage loan portfolio was 1.79% in 2009 compared to .57% for 2008. For the fourth
quarter of 2009, the annualized gross charge-off rate was 2.00% compared to 2.00% for the third quarter of 2009.
The residential mortgage problem credits began to stabilize somewhat in the fourth quarter of 2009, as
delinquencies came down and loss rates remained stable.
54