BB&T 2009 Annual Report Download - page 59
Download and view the complete annual report
Please find page 59 of the 2009 BB&T annual report below. You can navigate through the pages in the report by either clicking on the pages listed below, or by using the keyword search tool below to find specific information within the annual report.-
 1
1 -
2
-
3
-
4
-
5
-
6
-
7
-
8
-
9
-
10
-
11
-
12
-
13
-
14
-
15
-
16
-
17
-
18
-
19
-
20
-
21
-
22
-
23
-
24
-
25
-
26
-
27
-
28
-
29
-
30
-
31
-
32
-
33
-
34
-
35
-
36
-
37
-
38
-
39
-
40
-
41
-
42
-
43
-
44
-
45
-
46
-
47
-
48
-
 49
49 -
 50
50 -
 51
51 -
 52
52 -
 53
53 -
 54
54 -
 55
55 -
 56
56 -
 57
57 -
 58
58 -
 59
59 -
 60
60 -
 61
61 -
 62
62 -
 63
63 -
 64
64 -
 65
65 -
 66
66 -
 67
67 -
 68
68 -
 69
69 -
70
-
71
-
72
-
73
-
74
-
75
-
76
-
77
-
78
-
79
-
80
-
81
-
82
-
83
-
84
-
85
-
86
-
87
-
88
-
89
-
90
-
91
-
92
-
93
-
94
-
95
-
96
-
97
-
98
-
99
-
100
-
101
-
102
-
103
-
104
-
105
-
106
-
107
-
108
-
109
-
110
-
111
-
112
-
113
-
114
-
115
-
116
-
117
-
118
-
119
-
120
-
121
-
122
-
123
-
124
-
125
-
126
-
127
-
128
-
129
-
130
-
131
-
132
-
133
-
134
-
135
-
136
-
137
-
138
-
139
-
140
-
141
-
142
-
143
-
144
-
145
-
146
-
147
-
148
-
149
-
150
-
151
-
152
-
153
-
154
-
155
-
156
-
157
-
158
-
159
-
160
-
161
-
162
-
163
-
164
-
165
-
166
-
167
-
168
-
169
-
170
 |
 |
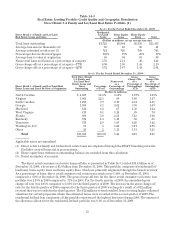
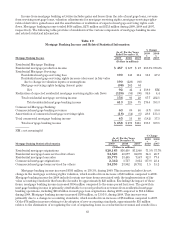
Analysis of Results of Operations
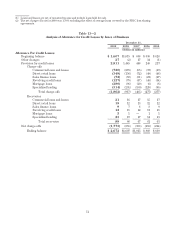
Consolidated net income for 2009 totaled $877 million. Net income available to common shareholders totaled
$729 million, which generated basic earnings per common share of $1.16 and diluted earnings per common share of
$1.15. Net income for 2008 was $1.53 billion and net income available to common shareholders totaled $1.50 billion.
Net income for 2007 totaled $1.75 billion. Basic earnings per common share were $2.73 in 2008 and $3.17 in 2007,
while diluted earnings per common share were $2.71 and $3.14 for 2008 and 2007, respectively.
Two important and commonly used measures of bank profitability are return on average assets (net income
as a percentage of average total assets) and return on average common shareholders’ equity (net income available
to common shareholders as a percentage of average common shareholders’ equity). BB&T’s returns on average
assets were .56%, 1.12%, and 1.38% for the years ended December 31, 2009, 2008 and 2007, respectively. The
returns on average common shareholders’ equity were 4.93%, 11.44%, and 14.25% for the last three years.
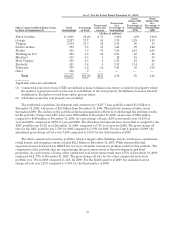
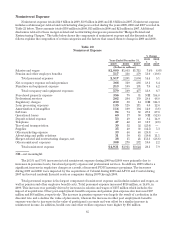
Net Interest Income
Net interest income is BB&T’s primary source of revenue. Net interest income is influenced by a number of
factors, including the volume, mix and maturity of interest-earning assets and interest-bearing liabilities and the
interest rates earned and paid thereon. The difference between rates earned on interest-earning assets and the
cost of the supporting funds (with an adjustment made to tax-exempt items to provide comparability with taxable
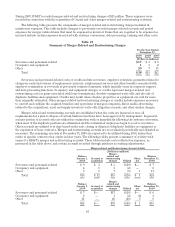
items, i.e. the “FTE” adjustment) is measured by the net interest margin. The accompanying table presents the
dollar amount of changes in interest income and interest expense, and distinguishes between the changes related
to increases or decreases in average outstanding balances of interest-earning assets and interest-bearing
liabilities (volume), and the changes related to increases or decreases in average interest rates on such assets and
liabilities (rate). Changes attributable to both volume and rate have been allocated proportionately.
For 2009, net interest income on an FTE-adjusted basis totaled $5.0 billion, compared with $4.3 billion in 2008
and $3.9 billion in 2007. Net interest income increased 14.9% in 2009 compared to 2008. The increase in net
interest income during 2009 resulted primarily from a combination of factors. First, earning asset growth has
helped offset the declines in yields due to the rate environment, as well as higher yields from the covered loan
portfolio. Second, management has been successful in controlling liability costs by engineering a favorable mix
change in both deposit and funding costs. These positives were partially offset by higher levels of nonaccruals
that have negatively affected net interest income and the net interest margin. Net interest income increased 9.4%
in 2008 compared to 2007 due primarily to liability costs repricing more quickly as short-term rates declined
throughout the year.
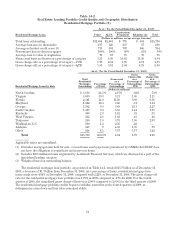
The FTE-adjusted net interest margin is the primary measure used in evaluating the gross profit margin
from the portfolios of earning assets. The FTE-adjusted net interest margin was 3.66% in 2009, 3.58% in 2008 and
3.52% in 2007. During 2009, the average yield on interest earning assets decreased 88 basis points compared to
the average yield during 2008, while the average cost of funds over the same time period decreased 108 basis
points. The improvement in the net interest margin during 2009 was primarily due to successfully managing
liability costs and wider spreads on assets. The net interest margin in 2008 was negatively impacted five basis
points by an adjustment of $67 million, as a result of a change in the income recognition on leveraged lease
transactions in connection with BB&T’s settlement with the Internal Revenue Service (“IRS”). In addition, the
net interest margin has been negatively affected by the higher level of non-performing assets in 2009 and 2008.
The improvement in the net interest margin during 2008 was caused by a combination of factors. BB&T entered
2008 in a liability sensitive position, which means that interest-bearing liabilities generally reprice more
frequently than interest-earning assets. This resulted in lower funding costs throughout 2008, as the Federal
Reserve Board lowered short-term rates by 100 basis points in the last four months of 2007 and an additional 400
basis points during 2008. Additionally, BB&T experienced some improvement in loan pricing in 2008.
59