BB&T 2009 Annual Report Download - page 62
Download and view the complete annual report
Please find page 62 of the 2009 BB&T annual report below. You can navigate through the pages in the report by either clicking on the pages listed below, or by using the keyword search tool below to find specific information within the annual report.-
 1
1 -
2
-
3
-
4
-
5
-
6
-
7
-
8
-
9
-
10
-
11
-
12
-
13
-
14
-
15
-
16
-
17
-
18
-
19
-
20
-
21
-
22
-
23
-
24
-
25
-
26
-
27
-
28
-
29
-
30
-
31
-
32
-
33
-
34
-
35
-
36
-
37
-
38
-
39
-
40
-
41
-
42
-
43
-
44
-
45
-
46
-
47
-
48
-
49
-
50
-
51
-
 52
52 -
 53
53 -
 54
54 -
 55
55 -
 56
56 -
 57
57 -
 58
58 -
 59
59 -
 60
60 -
 61
61 -
 62
62 -
 63
63 -
 64
64 -
 65
65 -
 66
66 -
 67
67 -
 68
68 -
 69
69 -
 70
70 -
 71
71 -
 72
72 -
73
-
74
-
75
-
76
-
77
-
78
-
79
-
80
-
81
-
82
-
83
-
84
-
85
-
86
-
87
-
88
-
89
-
90
-
91
-
92
-
93
-
94
-
95
-
96
-
97
-
98
-
99
-
100
-
101
-
102
-
103
-
104
-
105
-
106
-
107
-
108
-
109
-
110
-
111
-
112
-
113
-
114
-
115
-
116
-
117
-
118
-
119
-
120
-
121
-
122
-
123
-
124
-
125
-
126
-
127
-
128
-
129
-
130
-
131
-
132
-
133
-
134
-
135
-
136
-
137
-
138
-
139
-
140
-
141
-
142
-
143
-
144
-
145
-
146
-
147
-
148
-
149
-
150
-
151
-
152
-
153
-
154
-
155
-
156
-
157
-
158
-
159
-
160
-
161
-
162
-
163
-
164
-
165
-
166
-
167
-
168
-
169
-
170
 |
 |
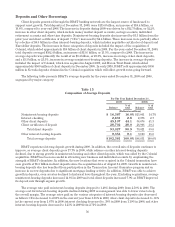
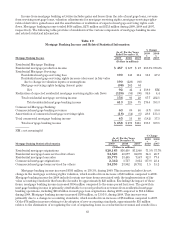
The 23.1% growth in noninterest income was the result of increased revenues from almost all of BB&T’s
fee-based businesses during 2009. These increases were partially offset by small declines in investment banking
and brokerage fees and commissions and trust and investment advisory revenues. During 2008, noninterest
income grew 15.2% as a result of increased revenues from all of BB&T’s fee-based businesses, with the exception
of declines in income from bank-owned life insurance and trust and investment advisory services. The major
categories of noninterest income and fluctuations in these amounts are discussed in the following paragraphs.
These fluctuations reflect the impact of acquisitions.
Income from BB&T’s insurance agency/brokerage operations was the largest source of noninterest income.
Internal growth, combined with the expansion of BB&T’s insurance agency network through acquisitions during
the last two years, resulted in growth of 12.8% in 2009 and 8.8% in 2008. The increase in insurance income in 2009
compared to 2008 was primarily driven by commissions for property and casualty insurance, which increased $77
million primarily due to acquisitions. In addition, employee benefit commissions and other insurance fees
increased $14 million and $11 million, respectively. The increase in commission income during 2008 was primarily
related to revenues from a new product initiative that was introduced in the second half of 2007. Additionally,
commissions for property and casualty and employee benefit insurance each increased $19 million.
Service charges on deposit accounts represent BB&T’s second largest category of noninterest revenue.
Service charge revenue grew $17 million, or 2.5%. Service charge revenue increased $62 million, or 10.1%, during
2008. The increase in 2009 was primarily a result of the acquisition of Colonial and growth in transaction accounts.
The 2008 increase was generated by increased revenues from overdraft items and strong transaction account
growth during 2008.
Investment banking and brokerage fees and commissions decreased $8 million, or 2.3%, compared to 2008.
The 3.2% increase in 2008 compared to 2007 resulted primarily from increased revenues of $19 million from BB&T
Capital Markets, a division of Scott & Stringfellow. This increase was partially offset by a decline of $13 million
related to commissions from retail accounts at Scott & Stringfellow.
Other nondeposit fees and commissions, including bankcard fees and merchant discounts and checkcard fees
increased $71 million, or 13.1%, during 2009 compared to 2008. During 2008, these categories increased $38
million, or 7.6%, compared to 2007. The growth in 2009 was partially due to a $27 million increase as a result of
issuing more letters of credit and other commercial loan servicing fees. The increases in 2009 and 2008 also
included additional checkcard fees of $26 million and $21 million, respectively, as clients continued to show a
preference for utilizing electronic forms of payment rather than traditional paper checks. Bankcard fees also grew
$5 million in 2009 compared to 2008 and $12 million in 2008 compared to 2007, as a result of strong sales of
merchant services.
Trust and investment advisory revenues are based on the types of services provided as well as the overall
value of the assets managed, which is affected by stock market conditions. During 2009, trust and investment
advisory revenues decreased by $8 million, or 5.4%, compared to 2008. During 2008, trust and investment
advisory revenues decreased by $15 million, or 9.3%, compared to 2007, primarily because of the decline in the
value of assets under management.
62