BB&T 2009 Annual Report Download - page 46
Download and view the complete annual report
Please find page 46 of the 2009 BB&T annual report below. You can navigate through the pages in the report by either clicking on the pages listed below, or by using the keyword search tool below to find specific information within the annual report.-
 1
1 -
2
-
3
-
4
-
5
-
6
-
7
-
8
-
9
-
10
-
11
-
12
-
13
-
14
-
15
-
16
-
17
-
18
-
19
-
20
-
21
-
22
-
23
-
24
-
25
-
26
-
27
-
28
-
29
-
30
-
31
-
32
-
33
-
34
-
35
-
 36
36 -
 37
37 -
 38
38 -
 39
39 -
 40
40 -
 41
41 -
 42
42 -
 43
43 -
 44
44 -
 45
45 -
 46
46 -
 47
47 -
 48
48 -
 49
49 -
 50
50 -
 51
51 -
 52
52 -
 53
53 -
 54
54 -
 55
55 -
 56
56 -
57
-
58
-
59
-
60
-
61
-
62
-
63
-
64
-
65
-
66
-
67
-
68
-
69
-
70
-
71
-
72
-
73
-
74
-
75
-
76
-
77
-
78
-
79
-
80
-
81
-
82
-
83
-
84
-
85
-
86
-
87
-
88
-
89
-
90
-
91
-
92
-
93
-
94
-
95
-
96
-
97
-
98
-
99
-
100
-
101
-
102
-
103
-
104
-
105
-
106
-
107
-
108
-
109
-
110
-
111
-
112
-
113
-
114
-
115
-
116
-
117
-
118
-
119
-
120
-
121
-
122
-
123
-
124
-
125
-
126
-
127
-
128
-
129
-
130
-
131
-
132
-
133
-
134
-
135
-
136
-
137
-
138
-
139
-
140
-
141
-
142
-
143
-
144
-
145
-
146
-
147
-
148
-
149
-
150
-
151
-
152
-
153
-
154
-
155
-
156
-
157
-
158
-
159
-
160
-
161
-
162
-
163
-
164
-
165
-
166
-
167
-
168
-
169
-
170
 |
 |

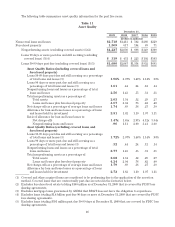
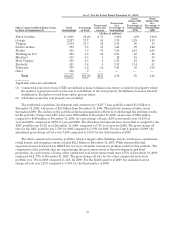
The following table summarizes asset quality information for the past five years.
Table 11
Asset Quality
December 31,
2009 2008 2007 2006 2005
(Dollars in millions)
Nonaccrual loans and leases $2,718 $1,413 $ 502 $ 260 $229
Foreclosed property 1,509 617 194 89 71
Nonperforming assets (excluding covered assets) (1)(2) $4,227 $2,030 $ 696 $ 349 $300
Loans 90 days or more past due and still accruing (excluding
covered loans) (3)(4) $ 319 $ 431 $ 223 $ 102 $103
Loans 30-89 days past due (excluding covered loans) (3)(5) $1,686 $2,047 $1,354 $ 952 $695
Asset Quality Ratios (including covered loans and
foreclosed property)
Loans 30-89 days past due and still accruing as a percentage
of total loans and leases (3) 1.96% 2.07% 1.48% 1.14% .93%
Loans 90 days or more past due and still accruing as a
percentage of total loans and leases (3) 1.61 .44 .24 .12 .14
Nonperforming loans and leases as a percentage of total
loans and leases 2.56 1.43 .55 .31 .31
Total nonperforming assets as a percentage of:
Total assets 2.65 1.34 .52 .29 .27
Loans and leases plus foreclosed property 4.07 2.04 .76 .42 .40
Net charge-offs as a percentage of average loans and leases 1.74 .89 .38 .27 .30
Allowance for loan and lease losses as a percentage of loans
and leases held for investment 2.51 1.62 1.10 1.07 1.11
Ratio of allowance for loan and lease losses to:
Net charge-offs 1.47x 1.85x 2.97x 4.12x 3.84x
Nonperforming loans and leases .96 1.11 2.00 3.41 3.60
Asset Quality Ratios (excluding covered loans and
foreclosed property)
Loans 30-89 days past due and still accruing as a percentage
of total loans and leases (3) 1.72% 2.07% 1.48% 1.14% .93%
Loans 90 days or more past due and still accruing as a
percentage of total loans and leases (3) .32 .44 .24 .12 .14
Nonperforming loans and leases as a percentage of total
loans and leases 2.77 1.43 .55 .31 .31
Total nonperforming assets as a percentage of:
Total assets 2.68 1.34 .52 .29 .27
Loans and leases plus foreclosed property 4.24 2.04 .76 .42 .40
Net charge-offs as a percentage of average loans and leases 1.79 .89 .38 .27 .30
Allowance for loan and lease losses as a percentage of loans
and leases held for investment 2.72 1.62 1.10 1.07 1.11
(1) Covered and other acquired loans are considered to be performing due to the application of the accretion
method. Covered loans that are contractually past due are noted in the footnotes below.
(2) Excludes foreclosed real estate totaling $160 million as of December 31, 2009 that is covered by FDIC loss
sharing agreements.
(3) Excludes mortgage loans guaranteed by GNMA that BB&T does not have the obligation to repurchase.
(4) Excludes loans totaling $1.4 billion past due 90 days or more at December 31, 2009 that are covered by FDIC
loss sharing agreements.
(5) Excludes loans totaling $391 million past due 30-89 days at December 31, 2009 that are covered by FDIC loss
sharing agreements.
46