BB&T 2009 Annual Report Download - page 147
Download and view the complete annual report
Please find page 147 of the 2009 BB&T annual report below. You can navigate through the pages in the report by either clicking on the pages listed below, or by using the keyword search tool below to find specific information within the annual report.-
 1
1 -
2
-
3
-
4
-
5
-
6
-
7
-
8
-
9
-
10
-
11
-
12
-
13
-
14
-
15
-
16
-
17
-
18
-
19
-
20
-
21
-
22
-
23
-
24
-
25
-
26
-
27
-
28
-
29
-
30
-
31
-
32
-
33
-
34
-
35
-
36
-
37
-
38
-
39
-
40
-
41
-
42
-
43
-
44
-
45
-
46
-
47
-
48
-
49
-
50
-
51
-
52
-
53
-
54
-
55
-
56
-
57
-
58
-
59
-
60
-
61
-
62
-
63
-
64
-
65
-
66
-
67
-
68
-
69
-
70
-
71
-
72
-
73
-
74
-
75
-
76
-
77
-
78
-
79
-
80
-
81
-
82
-
83
-
84
-
85
-
86
-
87
-
88
-
89
-
90
-
91
-
92
-
93
-
94
-
95
-
96
-
97
-
98
-
99
-
100
-
101
-
102
-
103
-
104
-
105
-
106
-
107
-
108
-
109
-
110
-
111
-
112
-
113
-
114
-
115
-
116
-
117
-
118
-
119
-
120
-
121
-
122
-
123
-
124
-
125
-
126
-
127
-
128
-
129
-
130
-
131
-
132
-
133
-
134
-
135
-
136
-
 137
137 -
 138
138 -
 139
139 -
 140
140 -
 141
141 -
 142
142 -
 143
143 -
 144
144 -
 145
145 -
 146
146 -
 147
147 -
 148
148 -
 149
149 -
 150
150 -
 151
151 -
 152
152 -
 153
153 -
 154
154 -
 155
155 -
 156
156 -
 157
157 -
158
-
159
-
160
-
161
-
162
-
163
-
164
-
165
-
166
-
167
-
168
-
169
-
170
 |
 |

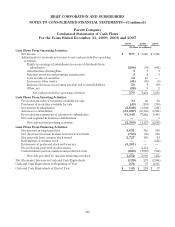
BB&T CORPORATION AND SUBSIDIARIES
NOTES TO CONSOLIDATED FINANCIAL STATEMENTS—(Continued)
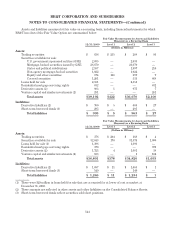
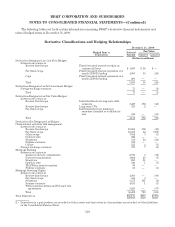
The following table details the fair value and unpaid principal balance of loans held for sale at December 31,
2009 and 2008 that were elected to be carried at fair value.
December 31,
2009 2008
Fair
Value
Aggregate
Unpaid
Principal
Balance
Fair Value Less
Aggregate
Unpaid
Principal
Balance Fair
Value
Aggregate
Unpaid
Principal
Balance
Fair Value Less
Aggregate
Unpaid
Principal
Balance
(Dollars in millions)
Loans held for sale reported at fair value
Total (1) $2,551 $2,544 $ 7 $1,396 $1,367 $ 29
Nonaccrual loans 5 6 (1) 11 —
Loans 90 days or more past due and
still accruing interest 22— 33 —
(1) The change in fair value is reflected in mortgage banking income.
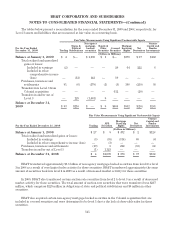
Also, BB&T may be required, from time to time, to measure certain other financial assets at fair value on a
nonrecurring basis. Assets measured at fair value on a nonrecurring basis for the years ended December 31, 2009
and 2008 that were still held on the balance sheet at December 31, 2009 and 2008 totaled $2.4 billion and $1.2
billion, respectively. The 2009 amount consists of $941 million of impaired loans, excluding covered loans, and $1.5
billion of foreclosed real estate, excluding covered foreclosed real estate, that were classified as Level 3 assets.
The 2008 amount consists of $638 million of impaired loans and $538 million of foreclosed real estate that were
classified as Level 3 assets. During the years ended December 31, 2009 and 2008, BB&T recorded $436 million and
$214 million, respectively, in losses related to write-downs of the loans and $224 million and $22 million,
respectively, in losses related to write-downs of foreclosed real estate based on the appraised value of the
underlying collateral.
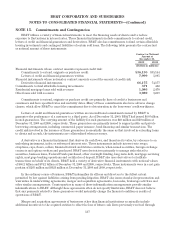
Accounting standards require the disclosure of the estimated fair value of all financial instruments. A
financial instrument is defined as cash, evidence of an ownership interest in an entity or a contract that creates a
contractual obligation or right to deliver or receive cash or another financial instrument from a second entity.
BB&T has recorded certain assets and liabilities at fair value based on the Fair Value Option or as required by
the applicable accounting standards. The following is a summary of the carrying amounts and fair values of those
financial assets and liabilities that BB&T has not recorded at fair value:
December 31,
2009 2008
Carrying
Amount Fair Value Carrying
Amount Fair
Value
(Dollars in millions)
Financial assets:
Loans and leases, net of allowance for loan and lease losses (1) $101,056 $100,794 $95,699 $96,025
Financial liabilities:
Deposits 114,965 112,917 98,613 98,877
Long-term debt 21,376 21,018 18,032 17,879
(1) Includes $28 million of loans held for sale for which the Fair Value Option was not elected at December 31,
2008.
147