BB&T 2009 Annual Report Download - page 158
Download and view the complete annual report
Please find page 158 of the 2009 BB&T annual report below. You can navigate through the pages in the report by either clicking on the pages listed below, or by using the keyword search tool below to find specific information within the annual report.-
 1
1 -
2
-
3
-
4
-
5
-
6
-
7
-
8
-
9
-
10
-
11
-
12
-
13
-
14
-
15
-
16
-
17
-
18
-
19
-
20
-
21
-
22
-
23
-
24
-
25
-
26
-
27
-
28
-
29
-
30
-
31
-
32
-
33
-
34
-
35
-
36
-
37
-
38
-
39
-
40
-
41
-
42
-
43
-
44
-
45
-
46
-
47
-
48
-
49
-
50
-
51
-
52
-
53
-
54
-
55
-
56
-
57
-
58
-
59
-
60
-
61
-
62
-
63
-
64
-
65
-
66
-
67
-
68
-
69
-
70
-
71
-
72
-
73
-
74
-
75
-
76
-
77
-
78
-
79
-
80
-
81
-
82
-
83
-
84
-
85
-
86
-
87
-
88
-
89
-
90
-
91
-
92
-
93
-
94
-
95
-
96
-
97
-
98
-
99
-
100
-
101
-
102
-
103
-
104
-
105
-
106
-
107
-
108
-
109
-
110
-
111
-
112
-
113
-
114
-
115
-
116
-
117
-
118
-
119
-
120
-
121
-
122
-
123
-
124
-
125
-
126
-
127
-
128
-
129
-
130
-
131
-
132
-
133
-
134
-
135
-
136
-
137
-
138
-
139
-
140
-
141
-
142
-
143
-
144
-
145
-
146
-
147
-
 148
148 -
 149
149 -
 150
150 -
 151
151 -
 152
152 -
 153
153 -
 154
154 -
 155
155 -
 156
156 -
 157
157 -
 158
158 -
 159
159 -
 160
160 -
 161
161 -
 162
162 -
 163
163 -
 164
164 -
 165
165 -
 166
166 -
 167
167 -
 168
168 -
169
-
170
 |
 |

BB&T CORPORATION AND SUBSIDIARIES
NOTES TO CONSOLIDATED FINANCIAL STATEMENTS—(Continued)
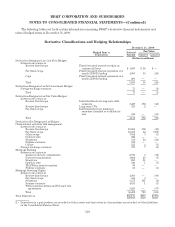
The following tables disclose selected financial information with respect to BB&T’s reportable business segments for the years indicated:
BB&T Corporation
Reportable Segments
For the Years Ended December 31, 2009, 2008 and 2007
Banking Network Residential Mortgage
Banking Sales Finance Specialized Lending Insurance Services
2009 2008 2007 2009 2008 2007 2009 2008 2007 2009 2008 2007 2009 2008 2007
(Dollars in millions)
Net interest income (expense) $ 1,638 $ 2,119 $ 2,305 $ 1,065 $ 1,135 $ 1,042 $ 409 $ 401 $ 376 $ 825 $ 711 $ 676 $ 5 $ 12 $ 18
Net funds transfer pricing (FTP) 1,925 1,118 1,141 (722) (835) (791) (284) (283) (256) (220) (210) (223) (3) (5) (4)
Net interest income (expense) and FTP 3,563 3,237 3,446 343 300 251 125 118 120 605 501 453 2 7 14
Economic provision for loan and lease losses 1,874 840 155 333 134 9 90 40 21 332 301 194 — — —
Noninterest income 1,293 1,235 1,095 607 224 120 2 2 2 119 116 90 1,032 907 839
Intersegment net referral fees (expense) 461 254 239 (146) (96) (92) (13) (13) (13) — — ————
Noninterest expense 2,081 1,544 1,472 128 84 64 31 28 25 284 243 206 772 697 624
Allocated corporate expenses 706 700 588 11 10 10 12 11 10 41 38 25 52 42 28
Income (loss) before income taxes 656 1,642 2,565 332 200 196 (19) 28 53 67 35 118 210 175 201
Provision (benefit) for income taxes 246 588 927 126 72 71 (7) 10 19 24 14 45 82 67 76
Segment net income (loss) $ 410 $ 1,054 $ 1,638 $ 206 $ 128 $ 125 $ (12) $ 18 $ 34 $ 43 $ 21 $ 73 $ 128 $ 108 $ 125
Identifiable segment assets (period end) $62,847 $65,194 $60,739 $19,040 $19,028 $18,503 $6,131 $6,117 $5,786 $ 8,162 $6,571 $5,608 $ 1,200 $ 1,253 $ 1,076
Financial Services Treasury All Other Segments (1) Parent/Reconciling
Items Total BB&T Corporation
2009 2008 2007 2009 2008 2007 2009 2008 2007 2009 2008 2007 2009 2008 2007
(Dollars in millions)
Net interest income (expense) $ 12 $ 47 $ 20 $ 630 $ 300 $ (134) $ 157 $ 105 $ 167 $ 103 $ (592) $ (590) $ 4,844 $ 4,238 $ 3,880
Net funds transfer pricing (FTP) 118 30 35 (689) (7) (158) (189) (171) (169) 64 363 425 — — —
Net interest income (expense) and FTP 130 77 55 (59) 293 (292) (32) (66) (2) 167 (229) (165) 4,844 4,238 3,880
Economic provision for loan and lease losses 12 8 — — — — 4 8 1 166 114 68 2,811 1,445 448
Noninterest income 674 638 553 326 265 111 35 34 58 (154) (224) (94) 3,934 3,197 2,774
Intersegment net referral fees (expense) 34 20 10 — — — — — — (336) (165) (144) — — —
Noninterest expense 542 544 481 6 (22) 8 63 26 81 1,024 767 663 4,931 3,911 3,624
Allocated corporate expenses 24 31 30 4 4 3 — 1 7 (850) (837) (701) — — —
Income (loss) before income taxes 260 152 107 257 576 (192) (64) (67) (33) (663) (662) (433) 1,036 2,079 2,582
Provision (benefit) for income taxes 100 56 36 28 161 (106) (67) (50) (23) (373) (368) (209) 159 550 836
Segment net income (loss) $ 160 $ 96 $ 71 $ 229 $ 415 $ (86) $ 3 $ (17) $ (10) $ (290) $ (294) $ (224) $ 877 $ 1,529 $ 1,746
Identifiable segment assets (period end) $ 3,077 $ 2,927 $ 4,118 $37,487 $37,438 $24,137 $5,306 $5,023 $3,934 $22,514 $8,464 $8,717 $165,764 $152,015 $132,618
(1) Includes financial data from subsidiaries below the quantitative and qualitative thresholds requiring disclosure.
158