BB&T 2009 Annual Report Download - page 77
Download and view the complete annual report
Please find page 77 of the 2009 BB&T annual report below. You can navigate through the pages in the report by either clicking on the pages listed below, or by using the keyword search tool below to find specific information within the annual report.-
 1
1 -
2
-
3
-
4
-
5
-
6
-
7
-
8
-
9
-
10
-
11
-
12
-
13
-
14
-
15
-
16
-
17
-
18
-
19
-
20
-
21
-
22
-
23
-
24
-
25
-
26
-
27
-
28
-
29
-
30
-
31
-
32
-
33
-
34
-
35
-
36
-
37
-
38
-
39
-
40
-
41
-
42
-
43
-
44
-
45
-
46
-
47
-
48
-
49
-
50
-
51
-
52
-
53
-
54
-
55
-
56
-
57
-
58
-
59
-
60
-
61
-
62
-
63
-
64
-
65
-
66
-
 67
67 -
 68
68 -
 69
69 -
 70
70 -
 71
71 -
 72
72 -
 73
73 -
 74
74 -
 75
75 -
 76
76 -
 77
77 -
 78
78 -
 79
79 -
 80
80 -
 81
81 -
 82
82 -
 83
83 -
 84
84 -
 85
85 -
 86
86 -
 87
87 -
88
-
89
-
90
-
91
-
92
-
93
-
94
-
95
-
96
-
97
-
98
-
99
-
100
-
101
-
102
-
103
-
104
-
105
-
106
-
107
-
108
-
109
-
110
-
111
-
112
-
113
-
114
-
115
-
116
-
117
-
118
-
119
-
120
-
121
-
122
-
123
-
124
-
125
-
126
-
127
-
128
-
129
-
130
-
131
-
132
-
133
-
134
-
135
-
136
-
137
-
138
-
139
-
140
-
141
-
142
-
143
-
144
-
145
-
146
-
147
-
148
-
149
-
150
-
151
-
152
-
153
-
154
-
155
-
156
-
157
-
158
-
159
-
160
-
161
-
162
-
163
-
164
-
165
-
166
-
167
-
168
-
169
-
170
 |
 |

determined in accordance with risk factors specified by Federal bank regulatory pronouncements. As of
December 31, 2009, federal bank regulators did not prescribe measures of tangible capital and, therefore, these
measures were considered non-GAAP. BB&T uses the Tier 1 common equity definition used in the SCAP
assessment to calculate measures of tangible capital and Tier 1 common capital. BB&T’s management uses these
measures to assess the quality of capital and believes that investors may find them useful in their analysis of the
Corporation. These capital measures are not necessarily comparable to similar capital measures that may be
presented by other companies.
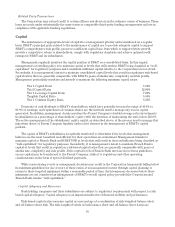
Tier 1 capital is calculated as common shareholders’ equity, excluding the over- or underfunded status of
postretirement benefit obligations, unrealized gains or losses on debt securities available for sale, unrealized
gains on equity securities available for sale and unrealized gains or losses on cash flow hedges, net of deferred
income taxes; plus certain mandatorily redeemable capital securities, less nonqualifying intangible assets, net of
applicable deferred income taxes, and certain nonfinancial equity investments. Tier 2 capital may consist of
qualifying subordinated debt, certain hybrid capital instruments, qualifying preferred stock and a limited amount
of the allowance for credit losses. Tier 1 capital and Tier 2 capital combined are referred to as total regulatory
capital. Tier 1 capital is required to be at least 4% of risk-weighted assets, and total capital must be at least 8% of
risk-weighted assets, with one half of the minimum consisting of Tier 1 capital.
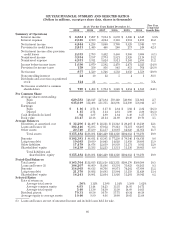
In addition to the risk-based capital measures described above, regulators have also established minimum
leverage capital requirements for banking organizations. The minimum required Tier 1 leverage ratio ranges
from 3% to 5% depending upon Federal bank regulatory agency evaluations of an organization’s overall safety
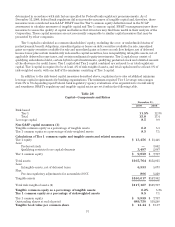
and soundness. BB&T’s regulatory and tangible capital ratios are set forth in the following table.
Table 28
Capital—Components and Ratios
December 31,
2009 2008
Risk-based:
Tier 1 11.5% 12.3%
Total 15.8 17.4
Leverage capital 8.5 9.9
Non-GAAP capital measures (1)
Tangible common equity as a percentage of tangible assets 6.2 5.3
Tier 1 common equity as a percentage of risk-weighted assets 8.5 7.1
Calculations of Tier 1 common equity and tangible assets and related measures:
Tier 1 equity $ 13,456 $ 13,446
Less:
Preferred stock —3,082
Qualifying restricted core capital elements 3,497 2,607
Tier 1 common equity $ 9,959 $ 7,757
Total assets $165,764 $152,015
Less:
Intangible assets, net of deferred taxes 6,553 5,873
Plus:
Pre-tax regulatory adjustments for accumulated OCI 806 1,220
Tangible assets $160,017 $147,362
Total risk-weighted assets (2) $117,167 $109,757
Tangible common equity as a percentage of tangible assets 6.2% 5.3%
Tier 1 common equity as a percentage of risk-weighted assets 8.5 7.1
Tier 1 common equity $ 9,959 $ 7,757
Outstanding shares at end of period 689,750 559,248
Tangible book value per common share $ 14.44 $ 13.87
77