BB&T 2009 Annual Report Download - page 85
Download and view the complete annual report
Please find page 85 of the 2009 BB&T annual report below. You can navigate through the pages in the report by either clicking on the pages listed below, or by using the keyword search tool below to find specific information within the annual report.-
 1
1 -
2
-
3
-
4
-
5
-
6
-
7
-
8
-
9
-
10
-
11
-
12
-
13
-
14
-
15
-
16
-
17
-
18
-
19
-
20
-
21
-
22
-
23
-
24
-
25
-
26
-
27
-
28
-
29
-
30
-
31
-
32
-
33
-
34
-
35
-
36
-
37
-
38
-
39
-
40
-
41
-
42
-
43
-
44
-
45
-
46
-
47
-
48
-
49
-
50
-
51
-
52
-
53
-
54
-
55
-
56
-
57
-
58
-
59
-
60
-
61
-
62
-
63
-
64
-
65
-
66
-
67
-
68
-
69
-
70
-
71
-
72
-
73
-
74
-
 75
75 -
 76
76 -
 77
77 -
 78
78 -
 79
79 -
 80
80 -
 81
81 -
 82
82 -
 83
83 -
 84
84 -
 85
85 -
 86
86 -
 87
87 -
 88
88 -
 89
89 -
 90
90 -
 91
91 -
 92
92 -
 93
93 -
 94
94 -
 95
95 -
96
-
97
-
98
-
99
-
100
-
101
-
102
-
103
-
104
-
105
-
106
-
107
-
108
-
109
-
110
-
111
-
112
-
113
-
114
-
115
-
116
-
117
-
118
-
119
-
120
-
121
-
122
-
123
-
124
-
125
-
126
-
127
-
128
-
129
-
130
-
131
-
132
-
133
-
134
-
135
-
136
-
137
-
138
-
139
-
140
-
141
-
142
-
143
-
144
-
145
-
146
-
147
-
148
-
149
-
150
-
151
-
152
-
153
-
154
-
155
-
156
-
157
-
158
-
159
-
160
-
161
-
162
-
163
-
164
-
165
-
166
-
167
-
168
-
169
-
170
 |
 |

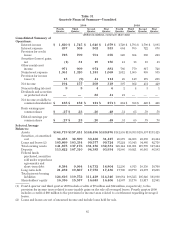
Table 31
Quarterly Financial Summary—Unaudited
2009 2008
Fourth
Quarter Third
Quarter Second
Quarter First
Quarter Fourth
Quarter Third
Quarter Second
Quarter First
Quarter
(Dollars in millions, except per share data)
Consolidated Summary of
Operations:
Interest income $ 1,820 $ 1,745 $ 1,640 $ 1,679 $ 1,729 $ 1,793 $ 1,790 $ 1,895
Interest expense 497 508 502 533 664 705 722 878
Provision for credit
losses 725 709 701 676 528 364 330 223
Securities (losses) gains,
net (1) 31 19 150 41 13 10 43
Other noninterest
income 971 909 974 881 766 779 817 728
Noninterest expense 1,361 1,320 1,181 1,069 1,012 1,005 959 935
Provision for income
taxes (1) 13 (9) 41 114 25 149 175 201
Net income 194 157 208 318 307 362 431 429
Noncontrolling interest 95 462431
Dividends and accretion
on preferred stock — — 83 41 21———
Net income available to
common shareholders $ 185 $ 152 $ 121 $ 271 $ 284 $ 358 $ 428 $ 428
Basic earnings per
common share $ .27 $ .23 .20 .48 .51 .65 .78 .78
Diluted earnings per
common share $ .27 $ .23 .20 .48 .51 .65 .78 .78
Selected Average
Balances:
Assets $164,719 $157,451 $148,496 $149,876 $141,555 $136,933 $135,557 $133,425
Securities, at amortized
cost 34,653 32,599 30,468 31,427 26,573 24,083 23,898 23,414
Loans and leases (2) 105,869 103,334 99,577 99,724 97,224 95,943 94,866 92,718
Total earning assets 141,875 137,176 131,156 132,331 125,144 121,001 119,799 117,414
Deposits 113,622 107,310 94,385 93,934 91,986 90,021 86,685 86,583
Federal funds
purchased, securities
sold under repurchase
agreements and
short-term debt 8,584 9,964 14,732 16,804 12,296 8,915 10,350 10,760
Long-term debt 21,232 19,867 17,755 17,436 17,700 20,770 21,697 19,201
Total interest-bearing
liabilities 124,616 119,752 111,429 114,346 108,684 106,525 105,646 103,868
Shareholders' equity 16,336 15,537 16,683 16,406 14,967 13,176 13,017 12,961
(1) Fourth quarter and third quarter 2009 include credits of $7 million and $12 million, respectively, to the
provision for income taxes related to non-taxable gains on the sale of leveraged leases. Fourth quarter 2008
includes a credit of $60 million to the provision for income taxes related to a settlement regarding leveraged
leases.
(2) Loans and leases are net of unearned income and include loans held for sale.
85