BB&T 2009 Annual Report Download - page 57
Download and view the complete annual report
Please find page 57 of the 2009 BB&T annual report below. You can navigate through the pages in the report by either clicking on the pages listed below, or by using the keyword search tool below to find specific information within the annual report.-
 1
1 -
2
-
3
-
4
-
5
-
6
-
7
-
8
-
9
-
10
-
11
-
12
-
13
-
14
-
15
-
16
-
17
-
18
-
19
-
20
-
21
-
22
-
23
-
24
-
25
-
26
-
27
-
28
-
29
-
30
-
31
-
32
-
33
-
34
-
35
-
36
-
37
-
38
-
39
-
40
-
41
-
42
-
43
-
44
-
45
-
46
-
 47
47 -
 48
48 -
 49
49 -
 50
50 -
 51
51 -
 52
52 -
 53
53 -
 54
54 -
 55
55 -
 56
56 -
 57
57 -
 58
58 -
 59
59 -
 60
60 -
 61
61 -
 62
62 -
 63
63 -
 64
64 -
 65
65 -
 66
66 -
 67
67 -
68
-
69
-
70
-
71
-
72
-
73
-
74
-
75
-
76
-
77
-
78
-
79
-
80
-
81
-
82
-
83
-
84
-
85
-
86
-
87
-
88
-
89
-
90
-
91
-
92
-
93
-
94
-
95
-
96
-
97
-
98
-
99
-
100
-
101
-
102
-
103
-
104
-
105
-
106
-
107
-
108
-
109
-
110
-
111
-
112
-
113
-
114
-
115
-
116
-
117
-
118
-
119
-
120
-
121
-
122
-
123
-
124
-
125
-
126
-
127
-
128
-
129
-
130
-
131
-
132
-
133
-
134
-
135
-
136
-
137
-
138
-
139
-
140
-
141
-
142
-
143
-
144
-
145
-
146
-
147
-
148
-
149
-
150
-
151
-
152
-
153
-
154
-
155
-
156
-
157
-
158
-
159
-
160
-
161
-
162
-
163
-
164
-
165
-
166
-
167
-
168
-
169
-
170
 |
 |

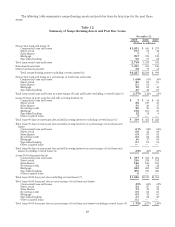
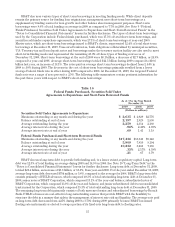
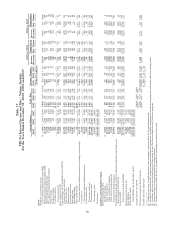
BB&T also uses various types of short-term borrowings in meeting funding needs. While client deposits
remain the primary source for funding loan originations, management uses short-term borrowings as a
supplementary funding source for loan growth and other balance sheet management purposes. Short-term
borrowings were 8.0% of total funding on average in 2009 as compared to 7.7% in 2008. See Note 9 “Federal
Funds Purchased, Securities Sold Under Agreements to Repurchase and Short-Term Borrowed Funds” in the
“Notes to Consolidated Financial Statements” herein for further disclosure. The types of short-term borrowings
used by the Corporation include Federal funds purchased, which was 17.5% of total short-term borrowings, and
securities sold under repurchase agreements, which was 27.1% of short-term borrowings at year-end 2009.
Master notes, which are short-term borrowings issued to BB&T’s clients, represented 12.4% of total short-term
borrowings at December 31, 2009. Unsecured bank notes, bank obligations collateralized by municipal securities,
U.S. Treasury tax and loan deposit notes and borrowings under the treasury auction facility are also used to meet
short-term funding needs and represented the remaining 43.0% of these types of funding sources as of
December 31, 2009. Short-term borrowings at the end of 2009 were $8.1 billion, a decrease of $2.7 billion, or 24.9%
compared to year-end 2008. Average short-term borrowings totaled $12.5 billion during 2009 compared to $10.6
billion last year, an increase of 18.1%. The rates paid on average short-term borrowings declined from 2.44% in
2008 to .50% during 2009. The decrease in the cost of short-term borrowings primarily resulted from a lower
average Federal funds rate in effect during 2009 compared to 2008. At December 31, 2009, the targeted Federal
funds rate was a range of zero percent to .25%. The following table summarizes certain pertinent information for
the past three years with respect to BB&T’s short-term borrowings:
Table 16
Federal Funds Purchased, Securities Sold Under
Agreements to Repurchase and Short-Term Borrowed Funds
As of / For the Year Ended
December 31,
2009 2008 2007
(Dollars in millions)
Securities Sold Under Agreements to Repurchase
Maximum outstanding at any month-end during the year $ 2,635 $ 2,929 $2,776
Balance outstanding at end of year 2,197 2,929 2,530
Average outstanding during the year 2,259 2,314 2,160
Average interest rate during the year .96% 2.40% 4.39%
Average interest rate at end of year .69 1.41 3.18
Federal Funds Purchased and Short-term Borrowed Funds
Maximum outstanding at any month-end during the year $17,436 $13,346 $9,148
Balance outstanding at end of year 5,909 7,859 8,104
Average outstanding during the year 10,232 8,266 7,165
Average interest rate during the year .35% 2.17% 4.39%
Average interest rate at end of year .21 .67 3.79
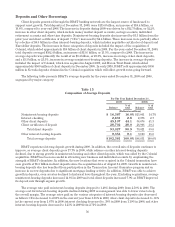
BB&T also uses long-term debt to provide both funding and, to a lesser extent, regulatory capital. Long-term
debt was 12.3% of total funding on average during 2009 and 14.5% in 2008. See Note 10 “Long-Term Debt” in the
“Notes to Consolidated Financial Statements” herein for further disclosure. Long-term debt at December 31, 2009,
totaled $21.4 billion, an increase of $3.3 billion, or 18.5%, from year-end 2008. For the year ended December 31, 2009,
average long-term debt decreased $754 million, or 3.8%, compared to the average for 2008. BB&T’s long-term debt
consists primarily of FHLB advances, which composed 49.3% of total outstanding long-term debt at December 31,
2009; senior notes of BB&T Corporation, which composed 13.1% of the year-end balance; subordinated notes of
BB&T Corporation, which composed 13.8% of the year-end balance; and junior subordinated debt to unconsolidated
trusts issued by the Corporation, which composed 15.3% of total outstanding long-term debt at December 31, 2009.
The remaining long-term debt primarily consists of both unsecured senior and subordinated borrowings by Branch
Bank. FHLB advances are cost-effective long-term funding sources that provide BB&T with the flexibility to
structure the debt in a manner that aids in the management of interest rate risk and liquidity. The average rate paid
on long-term debt decreased from 4.25% during 2008 to 3.73% during 2009 primarily because BB&T has issued
floating rate instruments or elected to swap a portion of its fixed-rate long-term debt to floating rates.
57