BB&T 2009 Annual Report Download - page 17
Download and view the complete annual report
Please find page 17 of the 2009 BB&T annual report below. You can navigate through the pages in the report by either clicking on the pages listed below, or by using the keyword search tool below to find specific information within the annual report.-
 1
1 -
2
-
3
-
4
-
5
-
6
-
 7
7 -
 8
8 -
 9
9 -
 10
10 -
 11
11 -
 12
12 -
 13
13 -
 14
14 -
 15
15 -
 16
16 -
 17
17 -
 18
18 -
 19
19 -
 20
20 -
 21
21 -
 22
22 -
 23
23 -
 24
24 -
 25
25 -
 26
26 -
 27
27 -
28
-
29
-
30
-
31
-
32
-
33
-
34
-
35
-
36
-
37
-
38
-
39
-
40
-
41
-
42
-
43
-
44
-
45
-
46
-
47
-
48
-
49
-
50
-
51
-
52
-
53
-
54
-
55
-
56
-
57
-
58
-
59
-
60
-
61
-
62
-
63
-
64
-
65
-
66
-
67
-
68
-
69
-
70
-
71
-
72
-
73
-
74
-
75
-
76
-
77
-
78
-
79
-
80
-
81
-
82
-
83
-
84
-
85
-
86
-
87
-
88
-
89
-
90
-
91
-
92
-
93
-
94
-
95
-
96
-
97
-
98
-
99
-
100
-
101
-
102
-
103
-
104
-
105
-
106
-
107
-
108
-
109
-
110
-
111
-
112
-
113
-
114
-
115
-
116
-
117
-
118
-
119
-
120
-
121
-
122
-
123
-
124
-
125
-
126
-
127
-
128
-
129
-
130
-
131
-
132
-
133
-
134
-
135
-
136
-
137
-
138
-
139
-
140
-
141
-
142
-
143
-
144
-
145
-
146
-
147
-
148
-
149
-
150
-
151
-
152
-
153
-
154
-
155
-
156
-
157
-
158
-
159
-
160
-
161
-
162
-
163
-
164
-
165
-
166
-
167
-
168
-
169
-
170
 |
 |
as BB&T’s success in attracting new accounts. BB&T also has seen an improvement in the deposit mix with
noninterest-bearing accounts representing 16.5% of total deposits at December 31, 2009, compared with 13.8% at
December 31, 2008.
Total shareholders’ equity increased slightly compared to December 31, 2008. BB&T’s common equity
increased as a result of the issuance of $2.6 billion in common stock during the second and third quarters of 2009,
retained earnings and an increase in accumulated other comprehensive income, which were partially offset by the
repayment of the $3.1 billion of preferred stock issued to the U.S. Treasury. The Tier 1 common ratio was 8.5% at
December 31, 2009. In addition, the Tier 1 risk-based capital and total risk-based capital ratios were 11.5% and
15.8% at December 31, 2009, respectively. BB&T’s risk-based and tangible capital ratios remain well above
regulatory standards for well-capitalized banks. As of December 31, 2009, measures of tangible capital were not
required by the regulators and, therefore, were considered non-GAAP measures. Please refer to the section titled
“Capital” herein for a discussion of how BB&T calculates and uses these measures in the evaluation of the
Company.
Competition
The financial services industry is highly competitive and dramatic change continues to occur in all aspects of
the Company’s business. The ability of nonbank financial entities to provide services previously reserved for
commercial banks has intensified competition. BB&T’s subsidiaries compete actively with national, regional and
local financial services providers, including banks, thrifts, securities dealers, mortgage bankers, finance
companies and insurance companies. Competition among providers of financial products and services continues to
increase, with consumers having the opportunity to select from a growing variety of traditional and
nontraditional alternatives. The industry continues to consolidate, which affects competition by eliminating some
regional and local institutions, while strengthening the franchises of acquirers. In addition, many financial
services entities are experiencing significant challenges as a result of the economic crisis, resulting in bank and
thrift failures and significant intervention from the U.S. Government. For additional information concerning
markets, BB&T’s competitive position and business strategies, and recent government interventions see “Market
Area”, “General Business Development” and “Regulatory Considerations” below.
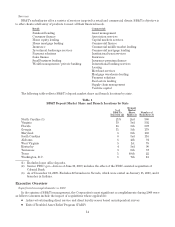
Market Area
BB&T’s primary market area for its banking operations consists of North and South Carolina, Virginia,
Maryland, Georgia, eastern Tennessee, West Virginia, Kentucky, Florida, Alabama and Washington, D.C. In
addition, BB&T has a smaller banking presence in Texas and Indiana. The Texas market represents a new
market for BB&T to expand its banking operations and was entered in connection with the Colonial acquisition.
The markets that BB&T operates have a diverse employment base and primarily consists of manufacturing,
general services, agricultural, wholesale/retail trade, technology, government and financial services. BB&T
believes its current market area will support growth in assets and deposits in the future. Management strongly
believes that BB&T’s community bank approach to providing client service is a competitive advantage that
strengthens the Corporation’s ability to effectively provide financial products and services to businesses and
individuals in its markets.
General Business Development
BB&T is a regional financial holding company. BB&T has maintained a long-term focus on a strategy that
includes expanding and diversifying the BB&T franchise in terms of revenues, profitability and asset size. This
strategy has encompassed both organic growth and acquisitions of complementary banks and financial businesses.
During the 1990’s and through 2003, BB&T’s growth resulted largely from mergers and acquisitions as the
economics of business combinations were compelling. Since that time, BB&T has focused more on organic growth
and strategic acquisitions, including the FDIC-assisted acquisition of Colonial.
Merger Strategy
BB&T’s growth in business, profitability and market share has historically been enhanced by strategic
mergers and acquisitions. Management intends to remain disciplined and focused with regard to future merger
and acquisition opportunities. BB&T will continue to assess bank and thrift acquisitions subject to market
17