BB&T 2009 Annual Report Download - page 50
Download and view the complete annual report
Please find page 50 of the 2009 BB&T annual report below. You can navigate through the pages in the report by either clicking on the pages listed below, or by using the keyword search tool below to find specific information within the annual report.-
 1
1 -
2
-
3
-
4
-
5
-
6
-
7
-
8
-
9
-
10
-
11
-
12
-
13
-
14
-
15
-
16
-
17
-
18
-
19
-
20
-
21
-
22
-
23
-
24
-
25
-
26
-
27
-
28
-
29
-
30
-
31
-
32
-
33
-
34
-
35
-
36
-
37
-
38
-
39
-
 40
40 -
 41
41 -
 42
42 -
 43
43 -
 44
44 -
 45
45 -
 46
46 -
 47
47 -
 48
48 -
 49
49 -
 50
50 -
 51
51 -
 52
52 -
 53
53 -
 54
54 -
 55
55 -
 56
56 -
 57
57 -
 58
58 -
 59
59 -
 60
60 -
61
-
62
-
63
-
64
-
65
-
66
-
67
-
68
-
69
-
70
-
71
-
72
-
73
-
74
-
75
-
76
-
77
-
78
-
79
-
80
-
81
-
82
-
83
-
84
-
85
-
86
-
87
-
88
-
89
-
90
-
91
-
92
-
93
-
94
-
95
-
96
-
97
-
98
-
99
-
100
-
101
-
102
-
103
-
104
-
105
-
106
-
107
-
108
-
109
-
110
-
111
-
112
-
113
-
114
-
115
-
116
-
117
-
118
-
119
-
120
-
121
-
122
-
123
-
124
-
125
-
126
-
127
-
128
-
129
-
130
-
131
-
132
-
133
-
134
-
135
-
136
-
137
-
138
-
139
-
140
-
141
-
142
-
143
-
144
-
145
-
146
-
147
-
148
-
149
-
150
-
151
-
152
-
153
-
154
-
155
-
156
-
157
-
158
-
159
-
160
-
161
-
162
-
163
-
164
-
165
-
166
-
167
-
168
-
169
-
170
 |
 |

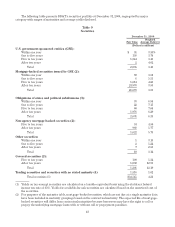
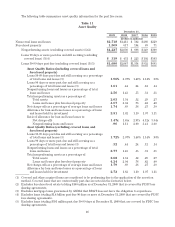
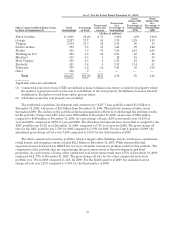
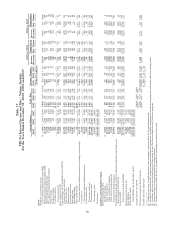
(1) Covered and other acquired loans are considered to be performing due to the application of the accretion method. Covered
loans that are contractually past due are noted in the footnotes below.
(2) Excludes foreclosed real estate totaling $160 million at December 31, 2009 that is covered by FDIC loss sharing agreements.
(3) Including loans covered by FDIC loss sharing agreements, nonaccrual loans and leases as a percentage of total loans and
leases was 2.56% as of December 31, 2009.
(4) Excludes mortgage loans guaranteed by GNMA that BB&T does not have the obligation to repurchase.
(5) Excludes loans totaling $1.4 billion past due 90 days or more at December 31, 2009 that are covered by FDIC loss sharing
agreements.
(6) Including loans covered by FDIC loss sharing agreements, loans past due 90 days or more and still accruing as a percentage
of total loans and leases was 1.61% as of December 31, 2009.
(7) Excludes loans totaling $391 million past due 30-89 days at December 31, 2009 that are covered by FDIC loss sharing
agreements.
(8) Including loans covered by FDIC loss sharing agreements, loans past due 30-89 days as a percentage of total loans and leases
was 1.96% as of December 31, 2009.
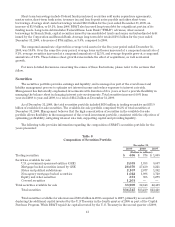
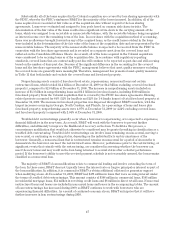
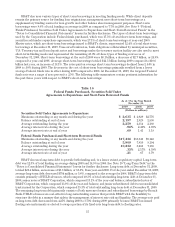
Allowance for Loan and Lease Losses and Reserve for Unfunded Lending Commitments
The allowance for loan and lease losses and the reserve for unfunded lending commitments compose BB&T’s
allowance for credit losses. The allowance for credit losses totaled $2.7 billion at December 31, 2009, an increase of
66.3% compared to $1.6 billion at the end of 2008. The allowance for loan and lease losses, as a percentage of loans
and leases held for investment, was 2.51% at December 31, 2009 (or 2.72% excluding covered loans), compared to
1.62% at year-end 2008. The allowance for credit losses increased by $1.1 billion during 2009, primarily as a result
of higher loss rates for residential real estate related lending, and their effect on the overall allowance model. The
growth of $1.1 billion in the allowance for credit losses reflects migrations of loans to higher risk grades, with the
most significant increases occurring in the single family residential, acquisition, development, and construction
loan portfolio and the consumer real estate portfolio. Please refer to Note 5 “Allowance for Loan and Lease
Losses and Reserve for Unfunded Lending Commitments” in the “Notes to Consolidated Financial Statements”
for additional disclosures.
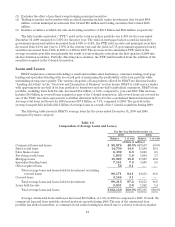
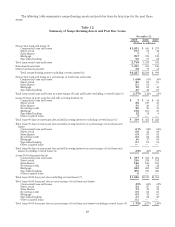
Information relevant to BB&T’s allowance for loan and lease losses for the last five years is presented in the
following tables. Table 13-1 is presented using regulatory classifications, which focuses on the underlying loan
collateral, and differs from internal classifications presented herein that focus on the lines of business that
generate the loans. Table 13-2 is presented based upon the lines of business, as discussed herein.
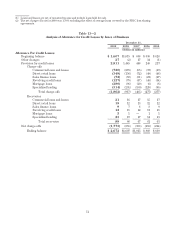
Table 13-1
Analysis of Allowance for Credit Losses
December 31,
2009 2008 2007 2006 2005
(Dollars in millions)
Balance, beginning of period $ 1,607 $ 1,015 $ 888 $ 830 $ 828
Charge-offs:
Commercial, financial and agricultural (214) (94) (40) (32) (52)
Real estate (1,157) (427) (93) (46) (45)
Consumer (477) (383) (264) (194) (174)
Lease receivables (14) (13) (8) (5) (6)
Total charge-offs (1,862) (917) (405) (277) (277)
Recoveries:
Commercial, financial and agricultural 16 10 11 12 14
Real estate 24 8878
Consumer 48 47 47 41 39
Lease receivables 11112
Total recoveries 89 66 67 61 63
Net charge-offs (1,773) (851) (338) (216) (214)
Provision charged to expense 2,811 1,445 448 240 217
Other changes 27 (2) 17 34 (1)
Balance, end of period $ 2,672 $ 1,607 $ 1,015 $ 888 $ 830
Average loans and leases (1) $102,146 $95,195 $87,952 $79,313 $71,517
Net charge-offs as a percentage of average loans and leases (1) (2) 1.74% .89% .38% .27% .30%
50