BB&T 2009 Annual Report Download - page 146
Download and view the complete annual report
Please find page 146 of the 2009 BB&T annual report below. You can navigate through the pages in the report by either clicking on the pages listed below, or by using the keyword search tool below to find specific information within the annual report.-
 1
1 -
2
-
3
-
4
-
5
-
6
-
7
-
8
-
9
-
10
-
11
-
12
-
13
-
14
-
15
-
16
-
17
-
18
-
19
-
20
-
21
-
22
-
23
-
24
-
25
-
26
-
27
-
28
-
29
-
30
-
31
-
32
-
33
-
34
-
35
-
36
-
37
-
38
-
39
-
40
-
41
-
42
-
43
-
44
-
45
-
46
-
47
-
48
-
49
-
50
-
51
-
52
-
53
-
54
-
55
-
56
-
57
-
58
-
59
-
60
-
61
-
62
-
63
-
64
-
65
-
66
-
67
-
68
-
69
-
70
-
71
-
72
-
73
-
74
-
75
-
76
-
77
-
78
-
79
-
80
-
81
-
82
-
83
-
84
-
85
-
86
-
87
-
88
-
89
-
90
-
91
-
92
-
93
-
94
-
95
-
96
-
97
-
98
-
99
-
100
-
101
-
102
-
103
-
104
-
105
-
106
-
107
-
108
-
109
-
110
-
111
-
112
-
113
-
114
-
115
-
116
-
117
-
118
-
119
-
120
-
121
-
122
-
123
-
124
-
125
-
126
-
127
-
128
-
129
-
130
-
131
-
132
-
133
-
134
-
135
-
 136
136 -
 137
137 -
 138
138 -
 139
139 -
 140
140 -
 141
141 -
 142
142 -
 143
143 -
 144
144 -
 145
145 -
 146
146 -
 147
147 -
 148
148 -
 149
149 -
 150
150 -
 151
151 -
 152
152 -
 153
153 -
 154
154 -
 155
155 -
 156
156 -
157
-
158
-
159
-
160
-
161
-
162
-
163
-
164
-
165
-
166
-
167
-
168
-
169
-
170
 |
 |

BB&T CORPORATION AND SUBSIDIARIES
NOTES TO CONSOLIDATED FINANCIAL STATEMENTS—(Continued)
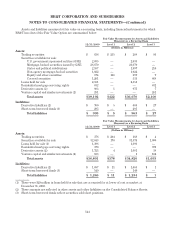
There were no gains or losses recognized as a result of the transfers of securities between level 2 and level 3
in either 2009 or 2008.
BB&T has investments in venture capital funds and other similar investments that are measured at fair
value based on the investment’s net asset value. The significant investment strategies for these ventures are
primarily equity and subordinated debt in privately-held middle market companies. The majority of these
investments are not redeemable and have varying dates for which the underlying assets are expected to be
liquidated by distribution through 2018. As of December 31, 2009, restrictions on the ability to sell the
investments include, but are not limited to, consent of majority member or general partner approval for transfer
of ownership. There were no investments probable of sale for less than net asset value at December 31, 2009.
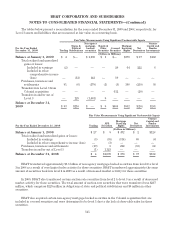
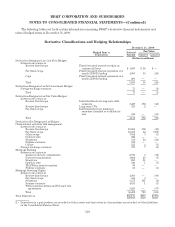
The tables below summarize unrealized and realized gains and losses recorded in earnings for Level 3 assets
and liabilities for the years ended December 31, 2009 and 2008, respectively.
Total Gains and Losses
For the Year Ended December 31, 2009 Trading Covered
Securities
Mortgage
Servicing
Rights Net Derivatives
Venture
Capital and
Similar
Investments
(Dollars in Millions)
Classification of gains and losses (realized/
unrealized) included in earnings for the period:
Interest income $— $ 20 $ — $— $—
Mortgage banking income — — 64 222 —
Other noninterest income (2) — — — 6
Total $ (2) $ 20 $ 64 $222 $ 6
Net unrealized gains (losses) included in net
income relating to assets and liabilities still
held at December 31, 2009 $ (3) $ 20 $ 190 $ (20) $ (2)
Total Gains and Losses
For the Year Ended December 31, 2008 AFS Securities Trading
Mortgage
Servicing
Rights Net Derivatives
Venture
Capital and
Similar
Investments
(Dollars in Millions)
Classification of gains and losses (realized/
unrealized) included in earnings for the period:
Securities gains (losses), net $ (35) $— $ — $— $—
Mortgage banking income — — (314) 68 —
Other noninterest income — (3) — — (8)
Total $ (35) $ (3) $(314) $ 68 $ (8)
Net unrealized gains (losses) included in net
income relating to assets and liabilities still
held at December 31, 2008 $— $— $(220) $ 37 $ (12)
For 2009, the net realized and unrealized gains reported for mortgage servicing rights assets are composed of
a positive valuation adjustment of $190 million less the realization of expected residential mortgage servicing
rights cash flows of $126 million. For 2008, the net realized and unrealized losses reported for mortgage servicing
rights assets are composed of a negative valuation adjustment of $220 million plus the realization of expected
residential mortgage servicing rights cash flows of $94 million. BB&T uses various derivative financial
instruments to mitigate the income statement effect of changes in fair value due to its quarterly valuation. During
2009 and 2008, the derivative instruments produced losses of $98 million and gains of $262 million, respectively,
which offset the valuation adjustments recorded.
146