BB&T 2009 Annual Report Download - page 80
Download and view the complete annual report
Please find page 80 of the 2009 BB&T annual report below. You can navigate through the pages in the report by either clicking on the pages listed below, or by using the keyword search tool below to find specific information within the annual report.-
 1
1 -
2
-
3
-
4
-
5
-
6
-
7
-
8
-
9
-
10
-
11
-
12
-
13
-
14
-
15
-
16
-
17
-
18
-
19
-
20
-
21
-
22
-
23
-
24
-
25
-
26
-
27
-
28
-
29
-
30
-
31
-
32
-
33
-
34
-
35
-
36
-
37
-
38
-
39
-
40
-
41
-
42
-
43
-
44
-
45
-
46
-
47
-
48
-
49
-
50
-
51
-
52
-
53
-
54
-
55
-
56
-
57
-
58
-
59
-
60
-
61
-
62
-
63
-
64
-
65
-
66
-
67
-
68
-
69
-
 70
70 -
 71
71 -
 72
72 -
 73
73 -
 74
74 -
 75
75 -
 76
76 -
 77
77 -
 78
78 -
 79
79 -
 80
80 -
 81
81 -
 82
82 -
 83
83 -
 84
84 -
 85
85 -
 86
86 -
 87
87 -
 88
88 -
 89
89 -
 90
90 -
91
-
92
-
93
-
94
-
95
-
96
-
97
-
98
-
99
-
100
-
101
-
102
-
103
-
104
-
105
-
106
-
107
-
108
-
109
-
110
-
111
-
112
-
113
-
114
-
115
-
116
-
117
-
118
-
119
-
120
-
121
-
122
-
123
-
124
-
125
-
126
-
127
-
128
-
129
-
130
-
131
-
132
-
133
-
134
-
135
-
136
-
137
-
138
-
139
-
140
-
141
-
142
-
143
-
144
-
145
-
146
-
147
-
148
-
149
-
150
-
151
-
152
-
153
-
154
-
155
-
156
-
157
-
158
-
159
-
160
-
161
-
162
-
163
-
164
-
165
-
166
-
167
-
168
-
169
-
170
 |
 |
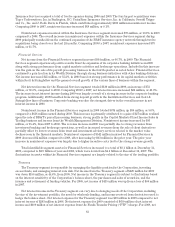
related to BB&T’s operating segments, the internal accounting and reporting practices used to manage these
segments and financial disclosures for these segments. Fluctuations in noninterest income and noninterest
expense incurred directly by the segments are more fully discussed in the “Noninterest Income” and
“Noninterest Expense” sections of this discussion and analysis.
Banking Network
The Banking Network had solid internal deposit growth, while the loan portfolios declined slightly due to the
general economic conditions and lack of strong demand for lending products during 2009. The total Banking
Network was composed of 1,857 banking offices at the end of 2009, an increase of 346 offices compared to 1,511
banking offices at December 31, 2008. The increase in offices was the result of the FDIC-assisted acquisition of
Colonial as well as a de novo branching strategy to expand BB&T’s presence in high growth markets. Net income
attributable to the Banking Network declined $644 million, or 61.1%, compared to 2008, primarily as a result of
higher provision for loan loss expense, credit related expenses primarily in owned real estate expense and FDIC
insurance premiums. Comparing 2008 to 2007, net income in the Banking Network decreased $584 million, or
35.7%.
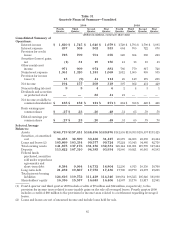
Net interest income for the Banking Network totaled $3.6 billion in 2009 compared to $3.2 billion in 2008. The
increase in net interest income was primarily due to an increase of $807 million in the net funds transfer pricing
(“FTP”) provided to the Banking Network during 2009, offset by a decrease of $481 million in net interest income
from clients. The decline in net interest income from clients in 2009 compared to 2008 was primarily due to lower
interest income on loans resulting from the sustained historically low prime rate and increased non-accrual loan
balances, partially offset through controlling liability costs. It is important to note that the acquired loan portfolio
is covered by the loss sharing agreement under the terms of the Colonial acquisition and managed outside of the
Banking Network. The assets and related interest income from this portfolio are included in the Parent/
Reconciling Items segment. New loans originated by the acquired Colonial branches after August 14, 2009 will be
managed as part of the Banking Network and the associated income will be included in this segment on a
go-forward basis. Net interest income earned for 2008 declined by $209 million, or 6.1%, compared to 2007. The
decline in the net interest income was primarily due to lower interest income on loans resulting from the decline
in the prime rate that began in late 2007.
The economic provision for loan and lease losses increased $1.0 billion, or 123.1%, in 2009 compared to 2008,
reflecting the continued deterioration in the residential acquisition and development and commercial real estate
portfolios. The economic provision for loan and lease losses increased $685 million, or 441.9%, from 2007 to 2008.
The increase during 2008 reflected the deterioration in the residential acquisition and development portfolio, as
well as growth in outstanding loans.
Noninterest income in the Banking Network increased $58 million, or 4.7%, during 2009. The acquisition of
the Colonial branches contributed $44 million in noninterest income to the Banking Network. The remaining
increase in noninterest income was primarily due to growth in bankcard fees, loan fees, and checkcard fees. In
2008, noninterest income increased $140 million, or 12.8%, primarily due to growth in overdraft fees, checkcard
fees, and other nondeposit fees and commissions. Noninterest income allocated from other segments, which is
reflected as intersegment net referral fees (“referral fees”), increased $207 million, or 81.5%, and $15 million, or
6.3%, in 2009 and 2008, respectively, primarily due to higher referrals for mortgage lending. Noninterest
expenses incurred within the Banking Network during 2009 increased $537 million, or 34.8%, compared to 2008.
The acquisition of the Colonial branches created $160 million of additional noninterest expense in 2009 for the
Banking Network. The remaining increase of $377 million was primarily due to the increase in credit related
expenses primarily in owned real estate expense and FDIC insurance premiums. Comparing 2008 to 2007,
noninterest expenses increased $72 million, or 4.9%. Allocated corporate expenses increased $6 million, or 0.9%, in
2009. Comparing 2008 to 2007, allocated corporate expenses increased $112 million, or 19.0%, primarily due to
increased allocations for certain corporate overhead functions that were previously not allocated to the business
units, and increases for loan administration expense, IT services and operations. The increase related to loan
administration expense was the result of a change in the methodology for allocating these expenses between
business segments.
Total identifiable assets for the Banking Network decreased $2.3 billion in 2009, or 3.6%, to a total of $62.8
billion, compared to an increase of $4.5 billion, or 7.3%, in 2008. The loan portfolios declined slightly due to the
80