BB&T 2009 Annual Report Download - page 81
Download and view the complete annual report
Please find page 81 of the 2009 BB&T annual report below. You can navigate through the pages in the report by either clicking on the pages listed below, or by using the keyword search tool below to find specific information within the annual report.-
 1
1 -
2
-
3
-
4
-
5
-
6
-
7
-
8
-
9
-
10
-
11
-
12
-
13
-
14
-
15
-
16
-
17
-
18
-
19
-
20
-
21
-
22
-
23
-
24
-
25
-
26
-
27
-
28
-
29
-
30
-
31
-
32
-
33
-
34
-
35
-
36
-
37
-
38
-
39
-
40
-
41
-
42
-
43
-
44
-
45
-
46
-
47
-
48
-
49
-
50
-
51
-
52
-
53
-
54
-
55
-
56
-
57
-
58
-
59
-
60
-
61
-
62
-
63
-
64
-
65
-
66
-
67
-
68
-
69
-
70
-
 71
71 -
 72
72 -
 73
73 -
 74
74 -
 75
75 -
 76
76 -
 77
77 -
 78
78 -
 79
79 -
 80
80 -
 81
81 -
 82
82 -
 83
83 -
 84
84 -
 85
85 -
 86
86 -
 87
87 -
 88
88 -
 89
89 -
 90
90 -
 91
91 -
92
-
93
-
94
-
95
-
96
-
97
-
98
-
99
-
100
-
101
-
102
-
103
-
104
-
105
-
106
-
107
-
108
-
109
-
110
-
111
-
112
-
113
-
114
-
115
-
116
-
117
-
118
-
119
-
120
-
121
-
122
-
123
-
124
-
125
-
126
-
127
-
128
-
129
-
130
-
131
-
132
-
133
-
134
-
135
-
136
-
137
-
138
-
139
-
140
-
141
-
142
-
143
-
144
-
145
-
146
-
147
-
148
-
149
-
150
-
151
-
152
-
153
-
154
-
155
-
156
-
157
-
158
-
159
-
160
-
161
-
162
-
163
-
164
-
165
-
166
-
167
-
168
-
169
-
170
 |
 |
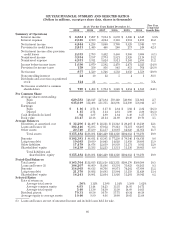
general economic conditions and lack of strong demand for lending products during 2009. Total identifiable assets
in 2009 included the assets from the Colonial acquisition except for assets covered by FDIC loss share
agreements and other acquired loans, while the 2008 balance included the assets from the acquisition of Haven
Trust.
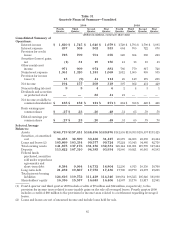
Residential Mortgage Banking
BB&T’s mortgage originations totaled $28.2 billion in 2009, up 71.5% from $16.4 billion in 2008. BB&T’s
residential mortgage servicing portfolio, which includes portfolio loans on BB&T’s balance sheet and loans
serviced for third parties, totaled $73.6 billion at year-end 2009 compared to $59.7 billion at December 31, 2008.
Net income attributable to the Residential Mortgage Banking segment increased by $78 million, or 60.9%, in 2009.
This increase was primarily due to strong growth in noninterest income, offset in part by an increase in the
economic provision for loan loss. Net income increased only slightly between 2008 and 2007, as strong growth in
noninterest income was offset by an increase in the economic provision for loan loss. 2008 results in the
Residential Mortgage Banking segment were also aided by the implementation of the Fair Value Option for loans
held for sale on January 1, 2008.
Net interest income for the Residential Mortgage Banking segment totaled $343 million in 2009, up 14.3%
compared to $300 million in 2008. Net interest income in 2008 was up 19.5% compared to 2007. The increase in net
interest income in 2009 and 2008 was primarily the result of growth in the held for investment loan portfolio and
associated lower funding costs.
The economic provision for loan and lease losses was $333 million for 2009, up $199 million, or 148.5%, from a
balance of $134 million in 2008. The growth in the provision reflected higher losses in 2009 and the deterioration in
residential real estate markets, especially in Florida, Georgia, Northern Virginia/ DC and some deterioration in
the coastal areas of the Carolinas.
Noninterest income in the Residential Mortgage Banking segment increased $383 million, or 171.0%, in 2009.
This increase is due to record residential mortgage production revenues and improved hedge performance of the
mortgage servicing asset. The higher mortgage originations reflect continued benefits from BB&T’s strong
position in the market as a reliable lender and the favorable interest rate environment. Noninterest income was
up $104 million, or 86.7%, in 2008 compared to 2007. This increase includes the impact of the implementation of
the Fair Value Option for loans held for sale, which resulted in an increase of approximately $21 million in
noninterest income when compared to 2007. The remaining variance included a $38 million increase in the net
mortgage servicing rights hedge results and growth in mortgage production revenue and loan servicing fees.
Noninterest expenses incurred in 2009 within the Residential Mortgage Banking segment increased $44 million,
or 52.4%, compared to 2008, and 2008 expenses were up $20 million, or 31.3%, as compared to 2007, primarily
reflecting higher incentives associated with the strong sales performance, loan origination costs and foreclosed
property expense.
Total 2009 identifiable assets at $19.0 billion for the Residential Mortgage Banking segment increased
slightly from 2008 and increased $525 million, or 2.8%, from 2008 to 2007. Increases in mortgage loans were due to
growth in loan originations in 2009 and 2008.
Sales Finance
The net loss from the Sales Finance segment was $12 million in 2009, down from net income of $18 million in
2008. This decline is primarily attributable to a higher economic provision for loan and lease losses and related
expenses, which more than offset growth in the overall loan portfolio. For 2008, net income reflected a decline of
$16 million, or 47.1%, compared to 2007.
Net interest income from the Sales Finance segment increased by $7 million, or 5.9%, during 2009 compared
to 2008. This is primarily due to $18 million in interest income growth generated by the indirect recreational and
marine vehicle portfolio, as well as $8 million in new interest income generated by an automobile loan portfolio
acquired in mid-2009. This growth was offset by a $19 million decline in net interest income from the indirect
automobile loan portfolio as a result of lower origination levels caused by weak consumer demand. Loan interest
margins remained stable as interest rates declined during 2009. During 2008, net interest income decreased by $2
million, compared to 2007. This decrease was due to a slightly lower margin.
81