BB&T 2009 Annual Report Download - page 83
Download and view the complete annual report
Please find page 83 of the 2009 BB&T annual report below. You can navigate through the pages in the report by either clicking on the pages listed below, or by using the keyword search tool below to find specific information within the annual report.-
 1
1 -
2
-
3
-
4
-
5
-
6
-
7
-
8
-
9
-
10
-
11
-
12
-
13
-
14
-
15
-
16
-
17
-
18
-
19
-
20
-
21
-
22
-
23
-
24
-
25
-
26
-
27
-
28
-
29
-
30
-
31
-
32
-
33
-
34
-
35
-
36
-
37
-
38
-
39
-
40
-
41
-
42
-
43
-
44
-
45
-
46
-
47
-
48
-
49
-
50
-
51
-
52
-
53
-
54
-
55
-
56
-
57
-
58
-
59
-
60
-
61
-
62
-
63
-
64
-
65
-
66
-
67
-
68
-
69
-
70
-
71
-
72
-
 73
73 -
 74
74 -
 75
75 -
 76
76 -
 77
77 -
 78
78 -
 79
79 -
 80
80 -
 81
81 -
 82
82 -
 83
83 -
 84
84 -
 85
85 -
 86
86 -
 87
87 -
 88
88 -
 89
89 -
 90
90 -
 91
91 -
 92
92 -
 93
93 -
94
-
95
-
96
-
97
-
98
-
99
-
100
-
101
-
102
-
103
-
104
-
105
-
106
-
107
-
108
-
109
-
110
-
111
-
112
-
113
-
114
-
115
-
116
-
117
-
118
-
119
-
120
-
121
-
122
-
123
-
124
-
125
-
126
-
127
-
128
-
129
-
130
-
131
-
132
-
133
-
134
-
135
-
136
-
137
-
138
-
139
-
140
-
141
-
142
-
143
-
144
-
145
-
146
-
147
-
148
-
149
-
150
-
151
-
152
-
153
-
154
-
155
-
156
-
157
-
158
-
159
-
160
-
161
-
162
-
163
-
164
-
165
-
166
-
167
-
168
-
169
-
170
 |
 |
Insurance Services acquired a total of twelve agencies during 2008 and 2009. The four largest acquisitions were
Tapco Underwriters, Inc. in Burlington, NC; UnionBanc Insurance Services, Inc. in California; Oswald Trippe
and Co., Inc. and J. Rolfe Davis in Florida, which contributed approximately $100 million in noninterest income.
Comparing 2008 to 2007, noninterest income increased $68 million, or 8.1%.
Noninterest expenses incurred within the Insurance Services segment increased $75 million, or 10.8% in 2009
compared to 2008. The overall increase in noninterest expenses within the Insurance Services segment during
2009 principally resulted from the continued expansion of the BB&T insurance agency network through twelve
acquisitions being closed over the last 24 months. Comparing 2008 to 2007, noninterest expenses increased $73
million, or 11.7%.
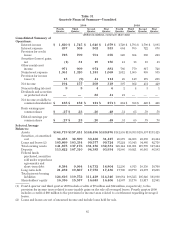
Financial Services
Net income from the Financial Services segment increased $64 million, or 66.7%, in 2009. The Financial
Services segment experienced positive results from the expansion of its corporate banking initiatives in 2009
along with strong performance from capital markets activities and brokerage operations. Included in this increase
was the gain on the sale of its payroll processing business in the fourth quarter as noted below. Financial Services
continued to gain traction in its Wealth Division through strong business initiatives with other banking divisions.
Net income increased $25 million, or 35.2%, in 2008 based on strong performance in its capital markets activities
within Scott & Stringfellow and the general overall growth of the various lines of business within the segment.
Net interest income for the Financial Services segment totaled $130 million in 2009, an increase of $53
million, or 68.8%, compared to 2008. Comparing 2008 to 2007, net interest income increased $22 million, or 40.0%.
The increase in net interest income during 2009 was largely a result of a strong increase in the corporate banking
program. Additionally, 2009 benefited from strong deposit growth in the Institutional Services and Scott &
Stringfellow lines of business. Corporate banking was also the strongest driver in the overall increase in net
interest income in 2008.
Noninterest income in the Financial Services segment in 2009 totaled $674 million, up $36 million, or 5.6%,
compared to $638 million earned during 2008. This increase is primarily attributed to a gain of $27 million realized
upon the sale of BB&T’s payroll processing business, strong profits in the Capital Markets Fixed Income Sales &
Trading business and income from the Wealth Management Division. Noninterest income increased by $85
million, or 15.4%, from 2007 to 2008. The revenue increase in 2008 was partially due to strong revenues from
investment banking and brokerage operations, as well as increased revenues from the sale of client derivatives
partially offset by lower revenues from trust and investment advisory services related to the market value
declines seen in the financial markets. Noninterest expenses of $542 million incurred by Financial Services in
2009 decreased $2 million compared to 2008, after increasing by $63 million in the prior year. The prior year
increase in noninterest expenses was largely due to higher incentive costs tied to the strong revenue growth.
Total identifiable segment assets for Financial Services increased to a total of $3.1 billion at December 31,
2009, compared to $2.9 billion at year-end 2008, which were down from $4.1 billion at December 31, 2007. The
fluctuations in assets within the Financial Services segment are largely related to the size of the trading portfolio.
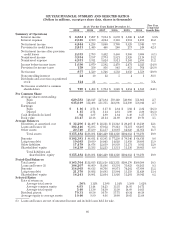
Treasury
The Treasury segment is responsible for managing the liquidity position for the Corporation, investing
excess funds, and managing interest rate risk. Net income from the Treasury segment of $229 million for 2009
was down $186 million, or 44.8%, from 2008. Net income in the Treasury segment is subject to fluctuations based
on the interest sensitivity of the Corporation’s balance sheet, the purchases and sales of securities, and the
issuance and retirement of funding vehicles. For 2008, net income of $415 million was up from a loss of $86 million
in 2007.
Net interest income in the Treasury segment can vary due to changing needs of the Corporation, including
the size of the investment portfolio, the need for wholesale funding, and income received from derivatives used to
hedge the balance sheet. Net interest expense for the Treasury segment was $59 million in 2009 compared to net
interest income of $293 million in 2008. Net interest expense for 2009 consisted of $630 million of net interest
income and $689 million of net interest expense from the Funds Transfer Pricing (“FTP”) charge. For 2008, net
83