BB&T 2009 Annual Report Download - page 112
Download and view the complete annual report
Please find page 112 of the 2009 BB&T annual report below. You can navigate through the pages in the report by either clicking on the pages listed below, or by using the keyword search tool below to find specific information within the annual report.-
 1
1 -
2
-
3
-
4
-
5
-
6
-
7
-
8
-
9
-
10
-
11
-
12
-
13
-
14
-
15
-
16
-
17
-
18
-
19
-
20
-
21
-
22
-
23
-
24
-
25
-
26
-
27
-
28
-
29
-
30
-
31
-
32
-
33
-
34
-
35
-
36
-
37
-
38
-
39
-
40
-
41
-
42
-
43
-
44
-
45
-
46
-
47
-
48
-
49
-
50
-
51
-
52
-
53
-
54
-
55
-
56
-
57
-
58
-
59
-
60
-
61
-
62
-
63
-
64
-
65
-
66
-
67
-
68
-
69
-
70
-
71
-
72
-
73
-
74
-
75
-
76
-
77
-
78
-
79
-
80
-
81
-
82
-
83
-
84
-
85
-
86
-
87
-
88
-
89
-
90
-
91
-
92
-
93
-
94
-
95
-
96
-
97
-
98
-
99
-
100
-
101
-
 102
102 -
 103
103 -
 104
104 -
 105
105 -
 106
106 -
 107
107 -
 108
108 -
 109
109 -
 110
110 -
 111
111 -
 112
112 -
 113
113 -
 114
114 -
 115
115 -
 116
116 -
 117
117 -
 118
118 -
 119
119 -
 120
120 -
 121
121 -
 122
122 -
123
-
124
-
125
-
126
-
127
-
128
-
129
-
130
-
131
-
132
-
133
-
134
-
135
-
136
-
137
-
138
-
139
-
140
-
141
-
142
-
143
-
144
-
145
-
146
-
147
-
148
-
149
-
150
-
151
-
152
-
153
-
154
-
155
-
156
-
157
-
158
-
159
-
160
-
161
-
162
-
163
-
164
-
165
-
166
-
167
-
168
-
169
-
170
 |
 |

BB&T CORPORATION AND SUBSIDIARIES
NOTES TO CONSOLIDATED FINANCIAL STATEMENTS—(Continued)
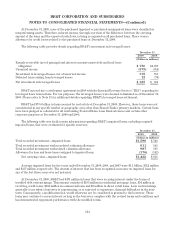
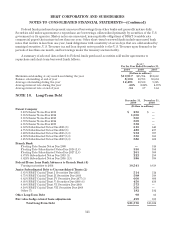
Summary Analysis Supporting Conclusions
The following table presents a detailed analysis of non-investment grade securities with significant
unrealized losses that are not covered by a loss sharing arrangement. The expected underlying collateral losses
represent losses on the underlying mortgage pools supporting BB&T’s tranche. The benefits from subordination
represent the amount of the expected losses the subordinate security holders are obligated to absorb prior to
BB&T incurring a loss.
Non-investment grade securities with significant unrealized losses
As of December 31, 2009
(Dollars in millions)
Security Amortized
Cost Fair
Value Unrealized
Loss
Credit Rating Expected Underlying
Collateral Losses Benefit of
SubordinationMoody’s S&P Fitch
Securities with other-than-temporary impairment losses (1):
RMBS 1 $ 61 $ 49 $(12) CCC CC $2 $2
RMBS 2 126 94 (32) CCC CCC 5 4
RMBS 3 60 49 (11) Ba2 B CCC 2 2
RMBS 4 161 121 (40) Caa1 CCC 7 7
RMBS 5 57 36 (21) Caa2 C 3 3
Securities without other-than-temporary impairment losses (2):
RMBS 6 62 19 (43) Caa1 CCC CC 2 2
RMBS 7 114 75 (39) Caa2 CCC 6 6
RMBS 8 49 37 (12) B3 CCC 2 2
RMBS 9 122 70 (52) CCC CCC 5 5
(1) The total amount of other-than-temporary impairment related to these securities was $133 million, and of
that amount $2 million was recognized in current year income while $131 million was recorded in other
comprehensive income.
(2) Additional benefits of subordination are available in excess of the expected underlying collateral losses.
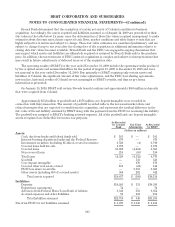
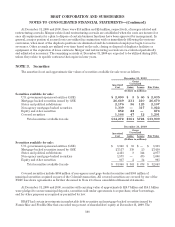
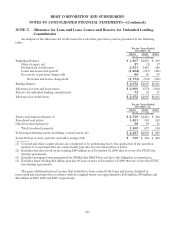
NOTE 4. Loans and Leases
The following table provides a breakdown of BB&T’s loan portfolio as of December 31, 2009 and 2008:
December 31,
2009 2008
(Dollars in millions)
Loans and leases, net of unearned income:
Commercial loans $ 49,445 $49,727
Leveraged leases 375 753
Total commercial loans and leases 49,820 50,480
Sales finance loans 6,290 6,354
Revolving credit loans 2,016 1,777
Direct retail loans 14,283 15,454
Residential mortgage loans 15,435 17,091
Specialized lending
Loans 6,953 5,527
Leases 717 562
Total specialized lending 7,670 6,089
Other acquired loans 123 —
Total loans and leases held for investment (excluding covered loans) 95,637 97,245
Covered loans 8,019 —
Total loans and leases held for investment (1) 103,656 97,245
Loans held for sale 2,551 1,424
Total loans and leases $106,207 $98,669
112