BB&T 2009 Annual Report Download - page 49
Download and view the complete annual report
Please find page 49 of the 2009 BB&T annual report below. You can navigate through the pages in the report by either clicking on the pages listed below, or by using the keyword search tool below to find specific information within the annual report.-
 1
1 -
2
-
3
-
4
-
5
-
6
-
7
-
8
-
9
-
10
-
11
-
12
-
13
-
14
-
15
-
16
-
17
-
18
-
19
-
20
-
21
-
22
-
23
-
24
-
25
-
26
-
27
-
28
-
29
-
30
-
31
-
32
-
33
-
34
-
35
-
36
-
37
-
38
-
 39
39 -
 40
40 -
 41
41 -
 42
42 -
 43
43 -
 44
44 -
 45
45 -
 46
46 -
 47
47 -
 48
48 -
 49
49 -
 50
50 -
 51
51 -
 52
52 -
 53
53 -
 54
54 -
 55
55 -
 56
56 -
 57
57 -
 58
58 -
 59
59 -
60
-
61
-
62
-
63
-
64
-
65
-
66
-
67
-
68
-
69
-
70
-
71
-
72
-
73
-
74
-
75
-
76
-
77
-
78
-
79
-
80
-
81
-
82
-
83
-
84
-
85
-
86
-
87
-
88
-
89
-
90
-
91
-
92
-
93
-
94
-
95
-
96
-
97
-
98
-
99
-
100
-
101
-
102
-
103
-
104
-
105
-
106
-
107
-
108
-
109
-
110
-
111
-
112
-
113
-
114
-
115
-
116
-
117
-
118
-
119
-
120
-
121
-
122
-
123
-
124
-
125
-
126
-
127
-
128
-
129
-
130
-
131
-
132
-
133
-
134
-
135
-
136
-
137
-
138
-
139
-
140
-
141
-
142
-
143
-
144
-
145
-
146
-
147
-
148
-
149
-
150
-
151
-
152
-
153
-
154
-
155
-
156
-
157
-
158
-
159
-
160
-
161
-
162
-
163
-
164
-
165
-
166
-
167
-
168
-
169
-
170
 |
 |

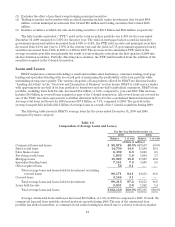
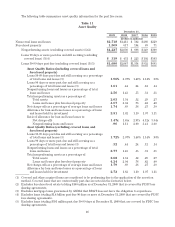
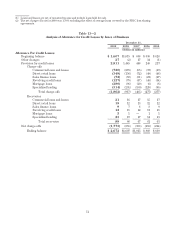
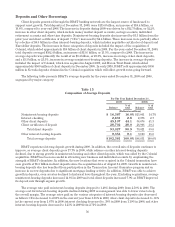
The following table summarizes nonperforming assets and past due loans by loan type for the past three
years.
Table 12
Summary of Nonperforming Assets and Past Due Loans
December 31,
2009 2008 2007
(Dollars in millions)
Nonaccrual loans and leases (1)
Commercial loans and leases $1,651 $ 845 $ 273
Direct retail 197 89 43
Sales finance 775
Mortgage 767 375 119
Specialized lending 96 97 62
Total nonaccrual loans and leases 2,718 1,413 502
Foreclosed real estate 1,451 538 143
Other foreclosed property 58 79 51
Total nonperforming assets (excluding covered assets) (2) $4,227 $2,030 $ 696
Nonaccrual loans and leases as a percentage of total loans and leases
Commercial loans and leases 1.68% .85% .30%
Direct retail .20 .09 .05
Sales finance .01 .01 —
Mortgage .78 .38 .13
Specialized lending .10 .10 .07
Total nonaccrual loans and leases as a percentage of loans and leases (excluding covered loans) (3) 2.77% 1.43% .55%
Loans 90 days or more past due and still accruing interest (4)
Commercial loans and leases $7$86$40
Direct retail 82 117 58
Sales finance 30 26 17
Revolving credit 25 23 15
Mortgage 158 165 85
Specialized lending 12 14 8
Other acquired loans 5——
Total loans 90 days or more past due and still accruing interest (excluding covered loans) (5) $ 319 $ 431 $ 223
Total loans 90 days or more past due and still accruing interest as a percentage of total loans and
leases
Commercial loans and leases .01% .09% .04%
Direct retail .08 .12 .06
Sales finance .03 .03 .02
Revolving credit .03 .02 .02
Mortgage .16 .17 .09
Specialized lending .01 .01 .01
Other acquired loans ———
Total loans 90 days or more past due and still accruing interest as a percentage of total loans and
leases (excluding covered loans) (6) .32% .44% .24%
Loans 30-89 days past due (4)
Commercial loans and leases $ 377 $ 594 $ 284
Direct retail 216 270 192
Sales finance 126 146 105
Revolving credit 32 34 24
Mortgage 623 690 506
Specialized lending 306 313 243
Other acquired loans 6——
Total loans 30-89 days past due (excluding covered loans) (7) $1,686 $2,047 $1,354
Total loans 30-89 days past due as a percentage of total loans and leases
Commercial loans and leases .39% .60% .31%
Direct retail .22 .27 .21
Sales finance .13 .15 .11
Revolving credit .03 .03 .03
Mortgage .63 .70 .55
Specialized lending .31 .32 .27
Other acquired loans .01 ——
Total loans 30-89 days past due as a percentage of total loans and leases (excluding covered loans) (8) 1.72% 2.07% 1.48%
49