BB&T 2009 Annual Report Download - page 135
Download and view the complete annual report
Please find page 135 of the 2009 BB&T annual report below. You can navigate through the pages in the report by either clicking on the pages listed below, or by using the keyword search tool below to find specific information within the annual report.-
 1
1 -
2
-
3
-
4
-
5
-
6
-
7
-
8
-
9
-
10
-
11
-
12
-
13
-
14
-
15
-
16
-
17
-
18
-
19
-
20
-
21
-
22
-
23
-
24
-
25
-
26
-
27
-
28
-
29
-
30
-
31
-
32
-
33
-
34
-
35
-
36
-
37
-
38
-
39
-
40
-
41
-
42
-
43
-
44
-
45
-
46
-
47
-
48
-
49
-
50
-
51
-
52
-
53
-
54
-
55
-
56
-
57
-
58
-
59
-
60
-
61
-
62
-
63
-
64
-
65
-
66
-
67
-
68
-
69
-
70
-
71
-
72
-
73
-
74
-
75
-
76
-
77
-
78
-
79
-
80
-
81
-
82
-
83
-
84
-
85
-
86
-
87
-
88
-
89
-
90
-
91
-
92
-
93
-
94
-
95
-
96
-
97
-
98
-
99
-
100
-
101
-
102
-
103
-
104
-
105
-
106
-
107
-
108
-
109
-
110
-
111
-
112
-
113
-
114
-
115
-
116
-
117
-
118
-
119
-
120
-
121
-
122
-
123
-
124
-
 125
125 -
 126
126 -
 127
127 -
 128
128 -
 129
129 -
 130
130 -
 131
131 -
 132
132 -
 133
133 -
 134
134 -
 135
135 -
 136
136 -
 137
137 -
 138
138 -
 139
139 -
 140
140 -
 141
141 -
 142
142 -
 143
143 -
 144
144 -
 145
145 -
146
-
147
-
148
-
149
-
150
-
151
-
152
-
153
-
154
-
155
-
156
-
157
-
158
-
159
-
160
-
161
-
162
-
163
-
164
-
165
-
166
-
167
-
168
-
169
-
170
 |
 |

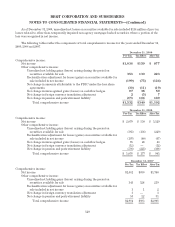
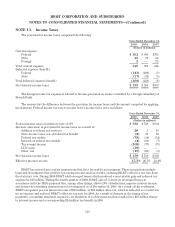
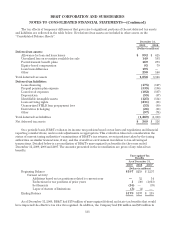
BB&T CORPORATION AND SUBSIDIARIES
NOTES TO CONSOLIDATED FINANCIAL STATEMENTS—(Continued)
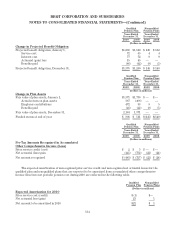
The accumulated benefit obligation for the qualified plans totaled $1.2 billion and $1.1 billion at December 31,
2009 and 2008, respectively. For the nonqualified plans, the accumulated benefit obligation totaled $133 million
and $123 million at December 31, 2009 and 2008, respectively.
Employer contributions to the qualified pension plan are in amounts between the minimum required for
funding standard accounts and the maximum amount deductible for federal income tax purposes. Management is
not required to make a contribution to the qualified pension plan during 2010; however, management may make
additional contributions during 2010 if deemed appropriate. For the nonqualified plans the employer
contributions are based on benefit payments. The following table reflects the estimated benefit payments
reflecting expected future service for the next five years and for the years 2015 through 2019.
Qualified
Pension
Plan
Nonqualified
Pension
Plans
(Dollars in millions)
Estimated Benefit Payments
2010 $48 $9
2011 52 9
2012 57 9
2013 62 9
2014 68 10
2015-2019 448 54
BB&T’s primary total return objective is to achieve returns that, over the long term, will fund retirement
liabilities and provide for the desired plan benefits in a manner that satisfies the fiduciary requirements of the
Employee Retirement Income Security Act. The plan assets have a long-term, indefinite time horizon that runs
concurrent with the average life expectancy of the participants. As such, the Plan can assume a time horizon that
extends well beyond a full market cycle, and can assume an above-average level of risk, as measured by the
standard deviation of annual return. It is expected, however, that both professional investment management and
sufficient portfolio diversification will smooth volatility and help to generate a reasonable consistency of return.
The investments are broadly diversified among economic sector, industry, quality and size in order to reduce risk
and to produce incremental return. Within approved guidelines and restrictions, investment managers have wide
discretion over the timing and selection of individual investments.
BB&T periodically reviews its asset allocation and investment policy and makes changes to its target asset
allocation. BB&T has established guidelines within each asset category to ensure the appropriate balance of risk and
reward. The current target asset allocations for the plan assets, which were established in 2006, include a range of 35%
to 45% for U.S. equity securities, 7% to 13% for international equity securities, 20% to 30% for fixed income securities,
and 10% to 30% for alternative investments, which include real estate, hedge funds, private equities and commodities,
with any remainder to be held in cash equivalents. In January 2009, the Compensation Committee amended the
Statement of Investment Policies to revise the asset allocation strategy for the Plan and the Trust to have no
additional investment in hedge funds and commodities until further notice. Currently, the asset allocations of other
plan asset classes may be outside of established parameters pending adoption of the new asset allocation strategy.
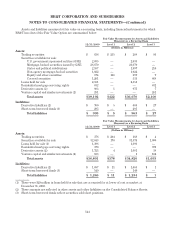
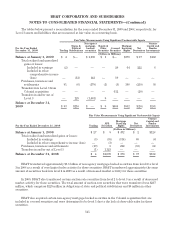
The fair value of BB&T’s pension plan assets at December 31, 2009, by asset category are as follows. The
three level fair value hierarchy that describes the inputs used to measure these plan assets is defined in Note 18
“Fair Value Disclosures”.
12/31/09
Fair Value Measurements for Plan Assets
Level 1 Level 2 Level 3
(dollars in millions)
Plan assets:
U.S equity securities (1) $ 977 $ 977 $— $—
International equity securities (2) 442 332 110 —
Fixed income securities 641 111 530 —
Alternative investments 117 — 25 92
Total plan assets (3) $2,177 $1,420 $665 $ 92
135