BB&T 2009 Annual Report Download - page 56
Download and view the complete annual report
Please find page 56 of the 2009 BB&T annual report below. You can navigate through the pages in the report by either clicking on the pages listed below, or by using the keyword search tool below to find specific information within the annual report.-
 1
1 -
2
-
3
-
4
-
5
-
6
-
7
-
8
-
9
-
10
-
11
-
12
-
13
-
14
-
15
-
16
-
17
-
18
-
19
-
20
-
21
-
22
-
23
-
24
-
25
-
26
-
27
-
28
-
29
-
30
-
31
-
32
-
33
-
34
-
35
-
36
-
37
-
38
-
39
-
40
-
41
-
42
-
43
-
44
-
45
-
 46
46 -
 47
47 -
 48
48 -
 49
49 -
 50
50 -
 51
51 -
 52
52 -
 53
53 -
 54
54 -
 55
55 -
 56
56 -
 57
57 -
 58
58 -
 59
59 -
 60
60 -
 61
61 -
 62
62 -
 63
63 -
 64
64 -
 65
65 -
 66
66 -
67
-
68
-
69
-
70
-
71
-
72
-
73
-
74
-
75
-
76
-
77
-
78
-
79
-
80
-
81
-
82
-
83
-
84
-
85
-
86
-
87
-
88
-
89
-
90
-
91
-
92
-
93
-
94
-
95
-
96
-
97
-
98
-
99
-
100
-
101
-
102
-
103
-
104
-
105
-
106
-
107
-
108
-
109
-
110
-
111
-
112
-
113
-
114
-
115
-
116
-
117
-
118
-
119
-
120
-
121
-
122
-
123
-
124
-
125
-
126
-
127
-
128
-
129
-
130
-
131
-
132
-
133
-
134
-
135
-
136
-
137
-
138
-
139
-
140
-
141
-
142
-
143
-
144
-
145
-
146
-
147
-
148
-
149
-
150
-
151
-
152
-
153
-
154
-
155
-
156
-
157
-
158
-
159
-
160
-
161
-
162
-
163
-
164
-
165
-
166
-
167
-
168
-
169
-
170
 |
 |

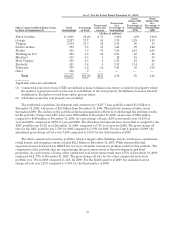
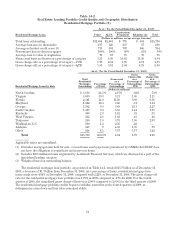
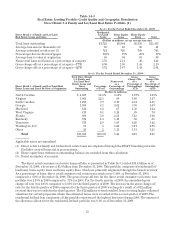
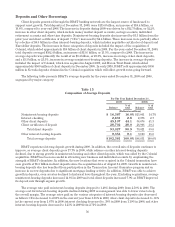
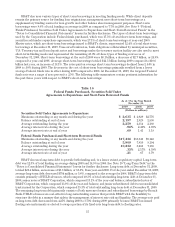
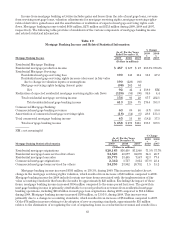
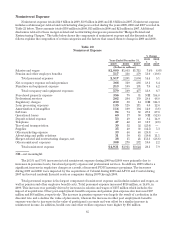
Deposits and Other Borrowings
Client deposits generated through the BB&T banking network are the largest source of funds used to
support asset growth. Total deposits at December 31, 2009, were $115.0 billion, an increase of $16.4 billion, or
16.6%, compared to year-end 2008. The increase in deposits during 2009 was driven by a $12.7 billion, or 32.2%,
increase in other client deposits, which include money market deposit accounts, savings accounts, individual
retirement accounts and other time deposits. Noninterest-bearing deposits also increased by $5.3 billion from the
prior year and client certificates of deposit (“CDs”) increased by $4.4 billion. These increases were partially offset
by a decline of $6.8 billion in other interest-bearing deposits, which includes negotiable certificates of deposit and
Eurodollar deposits. The increases in these categories of deposits included the impact of the acquisition of
Colonial, which added approximately $16 billion of client deposits in 2009. For the year ended December 31, 2009,
total deposits averaged $102.4 billion, an increase of $13.6 billion, or 15.3%, compared to 2008. The increase in
average deposits was primarily the result of an $8.4 billion, or 23.0%, increase in average other client deposits,
and a $3.3 billion, or 25.5%, increase in average noninterest-bearing deposits. The increase in average deposits
included the impact of Colonial, which was acquired in August 2009, and Haven Trust Bank, which added
approximately $500 million of client deposits in December 2008. In early 2010, BB&T sold approximately $850
million in Nevada deposits obtained in the Colonial acquisition which will affect growth rates going forward.
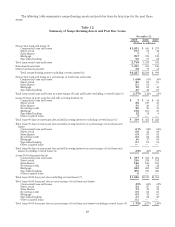
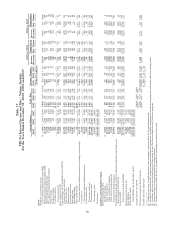
The following table presents BB&T’s average deposits for the years ended December 31, 2009 and 2008,
segregated by major category:
Table 15
Composition of Average Deposits
For The Year Ended December 31,
2009 2008
Balance %of
total Balance %of
total
(Dollars in millions)
Noninterest-bearing deposits $ 16,387 16.0% $13,061 14.7%
Interest checking 2,831 2.8 2,376 2.7
Other client deposits 45,107 44.1 36,676 41.3
Client certificates of deposit 28,702 28.0 26,908 30.3
Total client deposits 93,027 90.9 79,021 89.0
Other interest-bearing deposits 9,354 9.1 9,810 11.0
Total average deposits $102,381 100.0% $88,831 100.0%
BB&T experienced strong deposit growth during 2009. In addition, the overall mix of deposits continues to
improve, as average client deposits grew 17.7% in 2009, while reliance on other interest-bearing deposits
declined, due to strong growth in noninterest-bearing and other client deposits, which was aided by the Colonial
acquisition. BB&T has been successful in attracting new business and individual accounts by emphasizing the
strength of BB&T’s franchise. In addition, the new locations that were acquired in the Colonial transaction have
seen growth of $1.5 billion in client deposits since the acquisition date of August 14, 2009. Growth in noninterest-
bearing deposits also has benefited from participation in the Transaction Account Guarantee program and an
increase in escrow deposits due to significant mortgage lending activity. In addition, BB&T was able to achieve
growth in deposits, even as rates declined to historical lows throughout the year. Excluding acquisitions, average
noninterest-bearing deposits increased 14.8% in 2009 and total client deposits increased 7.9% as BB&T improved
its deposit mix through organic growth.
The average rate paid on interest-bearing deposits dropped to 1.48% during 2009, from 2.50% in 2008. The
average cost for interest-bearing deposits declined during 2009 as management was able to lower rates to help
the overall margin. The average rates paid on the various categories of interest-bearing deposits also decreased
as follows: CDs decreased to 2.60% in the current year from 3.66% in 2008; other client deposits decreased to .88%
in the current year from 1.67% in 2008; interest checking decreased to .39% in 2009 from 1.19% in 2008; and other
interest-bearing deposits decreased to 1.23% in 2009 from 2.71% in 2008.
56