Philips 2005 Annual Report Download - page 111
Download and view the complete annual report
Please find page 111 of the 2005 Philips annual report below. You can navigate through the pages in the report by either clicking on the pages listed below, or by using the keyword search tool below to find specific information within the annual report.-
 1
1 -
2
-
3
-
4
-
5
-
6
-
7
-
8
-
9
-
10
-
11
-
12
-
13
-
14
-
15
-
16
-
17
-
18
-
19
-
20
-
21
-
22
-
23
-
24
-
25
-
26
-
27
-
28
-
29
-
30
-
31
-
32
-
33
-
34
-
35
-
36
-
37
-
38
-
39
-
40
-
41
-
42
-
43
-
44
-
45
-
46
-
47
-
48
-
49
-
50
-
51
-
52
-
53
-
54
-
55
-
56
-
57
-
58
-
59
-
60
-
61
-
62
-
63
-
64
-
65
-
66
-
67
-
68
-
69
-
70
-
71
-
72
-
73
-
74
-
75
-
76
-
77
-
78
-
79
-
80
-
81
-
82
-
83
-
84
-
85
-
86
-
87
-
88
-
89
-
90
-
91
-
92
-
93
-
94
-
95
-
96
-
97
-
98
-
99
-
100
-
 101
101 -
 102
102 -
 103
103 -
 104
104 -
 105
105 -
 106
106 -
 107
107 -
 108
108 -
 109
109 -
 110
110 -
 111
111 -
 112
112 -
 113
113 -
 114
114 -
 115
115 -
 116
116 -
 117
117 -
 118
118 -
 119
119 -
 120
120 -
 121
121 -
122
-
123
-
124
-
125
-
126
-
127
-
128
-
129
-
130
-
131
-
132
-
133
-
134
-
135
-
136
-
137
-
138
-
139
-
140
-
141
-
142
-
143
-
144
-
145
-
146
-
147
-
148
-
149
-
150
-
151
-
152
-
153
-
154
-
155
-
156
-
157
-
158
-
159
-
160
-
161
-
162
-
163
-
164
-
165
-
166
-
167
-
168
-
169
-
170
-
171
-
172
-
173
-
174
-
175
-
176
-
177
-
178
-
179
-
180
-
181
-
182
-
183
-
184
-
185
-
186
-
187
-
188
-
189
-
190
-
191
-
192
-
193
-
194
-
195
-
196
-
197
-
198
-
199
-
200
-
201
-
202
-
203
-
204
-
205
-
206
-
207
-
208
-
209
-
210
-
211
-
212
-
213
-
214
-
215
-
216
-
217
-
218
-
219
-
220
-
221
-
222
-
223
-
224
-
225
-
226
-
227
-
228
-
229
-
230
-
231
-
232
 |
 |

Philips Annual Report 2005 111
quotations. Given the large liquidity of the derivative
instruments used, the unwind prices are not signifi cantly
different from the quoted fi gures.
Pensions
This section further analyzes the pension exposure and
possible risks thereof.
Pension-related exposure to changes in fi nancial markets
With pension obligations in more than 40 countries, the
Company has devoted considerable attention and resources
to ensuring disclosure, awareness and control of the
resulting exposures.
Depending on the investment policies of the respective
pension funds, the value of pension assets compared to
the related pension liabilities and the composition of such
assets, developments in fi nancial markets may have a
signifi cant effect on the funded status of the Company’s
pension plans and their related cost. To monitor the
corresponding risk exposure, a Global Risk Reward Model
for pensions has been developed. The model, which covers
approximately 95% of total pension liabilities and contains
separate modules for the Netherlands, the UK, the US and
Germany, allows estimates of the sensitivities to changes
in interest rates and equity market valuations.
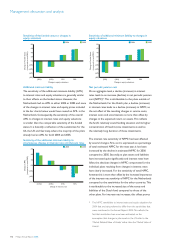
The bar charts in the sections below show the estimated
sensitivities to interest rates and equity market valuations
for the Netherlands, the UK, the US and Germany, on
aggregate, based upon the assets, liabilities, discount rates
and asset allocations as of December 31, 2005. They show
how much the aggregate funded status and additional
minimum liability would have differed from what they
actually were, if interest rates or equity valuations had
been lower or higher, and to what extent net periodic
pension cost (NPPC) for 2006 would have been affected.
All results are shown as a percentage of total projected
benefi t obligations (PBO) as of December 31, 2005
(amounting to EUR 21.1 billion) or total NPPC for 2006
(estimated to be EUR 186 million). NPPC 2006 has been
estimated excluding the effects of the additional funding in
the United Kingdom of GBP 400 million. The interest rate
sensitivities have been estimated on the assumption that
interest rates and discount rates change simultaneously.
The estimated sensitivities do not refl ect the correlation,
if any, between changes in interest rates and equity
market valuations.
Aside from the sensitivities for 2005, the charts also show
the comparable sensitivities for 2004. As plan rules and
investment policies have not changed much, the differences
between the sensitivities for 2005 and 2004 are largely
attributable to the increases in PBO and plan assets, the
declines in interest rates, the consequent lowering of
discount rates and the strengthening of the US and UK
currencies against the euro.
Funded status
A change in interest rates affects the values of both assets
and liabilities, whereas changes in equity valuations affect
asset values only. Generally speaking, the interest rate
sensitivity of the liabilities tends to be signifi cantly greater
than the sensitivity of pension assets. Consequently,
decreases in interest rates tend to have detrimental
effects on the funded status of a plan.
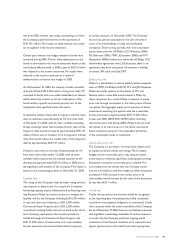
The sensitivity of the funded status of the Dutch plan to
interest rates and equity valuations is small compared to
that for the other plans. However, due to its relative size
(61% of the total PBO), it contributes more to the
aggregate sensitivity than other plans.
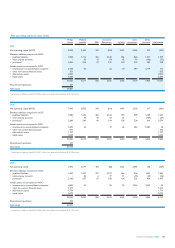
Sensitivity of the funded status to simultaneous changes in
interest rates and discount rates
2004 2005
Change in Funded Status
(compared to total PBO)
Change in interest rate
8%
6%
4%
2%
0%
(2%)
(4%)
(6%)
(8%)
(10%)
(1.0%) (0.5%) 0.5% 1.0%
With most of the liabilities unfunded and most of the
relevant assets invested in fi xed income instruments, the
German and UK plans have the lowest sensitivities to
equity valuations. Because a large part of the US pension
plan assets is invested in equities, the US plans have the
highest equity risk. As with the sensitivity to interest rates,
however, the sensitivity of the overall funded status is still
dominated by the equity exposure in the Netherlands.
Again, this is attributable to the size of the Dutch plan
compared to that of the pension plans in other countries.