Philips 2005 Annual Report Download - page 120
Download and view the complete annual report
Please find page 120 of the 2005 Philips annual report below. You can navigate through the pages in the report by either clicking on the pages listed below, or by using the keyword search tool below to find specific information within the annual report.-
 1
1 -
2
-
3
-
4
-
5
-
6
-
7
-
8
-
9
-
10
-
11
-
12
-
13
-
14
-
15
-
16
-
17
-
18
-
19
-
20
-
21
-
22
-
23
-
24
-
25
-
26
-
27
-
28
-
29
-
30
-
31
-
32
-
33
-
34
-
35
-
36
-
37
-
38
-
39
-
40
-
41
-
42
-
43
-
44
-
45
-
46
-
47
-
48
-
49
-
50
-
51
-
52
-
53
-
54
-
55
-
56
-
57
-
58
-
59
-
60
-
61
-
62
-
63
-
64
-
65
-
66
-
67
-
68
-
69
-
70
-
71
-
72
-
73
-
74
-
75
-
76
-
77
-
78
-
79
-
80
-
81
-
82
-
83
-
84
-
85
-
86
-
87
-
88
-
89
-
90
-
91
-
92
-
93
-
94
-
95
-
96
-
97
-
98
-
99
-
100
-
101
-
102
-
103
-
104
-
105
-
106
-
107
-
108
-
109
-
 110
110 -
 111
111 -
 112
112 -
 113
113 -
 114
114 -
 115
115 -
 116
116 -
 117
117 -
 118
118 -
 119
119 -
 120
120 -
 121
121 -
 122
122 -
 123
123 -
 124
124 -
 125
125 -
 126
126 -
 127
127 -
 128
128 -
 129
129 -
 130
130 -
131
-
132
-
133
-
134
-
135
-
136
-
137
-
138
-
139
-
140
-
141
-
142
-
143
-
144
-
145
-
146
-
147
-
148
-
149
-
150
-
151
-
152
-
153
-
154
-
155
-
156
-
157
-
158
-
159
-
160
-
161
-
162
-
163
-
164
-
165
-
166
-
167
-
168
-
169
-
170
-
171
-
172
-
173
-
174
-
175
-
176
-
177
-
178
-
179
-
180
-
181
-
182
-
183
-
184
-
185
-
186
-
187
-
188
-
189
-
190
-
191
-
192
-
193
-
194
-
195
-
196
-
197
-
198
-
199
-
200
-
201
-
202
-
203
-
204
-
205
-
206
-
207
-
208
-
209
-
210
-
211
-
212
-
213
-
214
-
215
-
216
-
217
-
218
-
219
-
220
-
221
-
222
-
223
-
224
-
225
-
226
-
227
-
228
-
229
-
230
-
231
-
232
 |
 |

Philips Annual Report 2005120
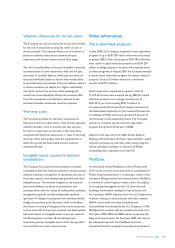
Lifeline Systems
On January 19, 2006, Philips announced that it has signed
an agreement to acquire Lifeline Systems for USD 690
million, net of USD 60 million cash acquired. Lifeline
Systems is a leading provider of personal response services
and emergency call systems in the USA and Canada.
For further information, please refer to note 39.
Reconciliation of non-US GAAP
information
Certain non-US GAAP fi nancial measures are presented
when discussing the Philips Group’s fi nancial position.
In the following tables, a reconciliation to the most
directly comparable US GAAP fi nancial measure is made
for each non-US GAAP performance measure. Where
appropriate the fi gures in the following reconciliations
have been restated to present the MDS activities as
discontinued operations.
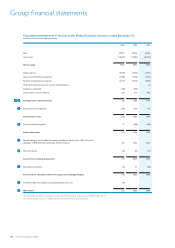
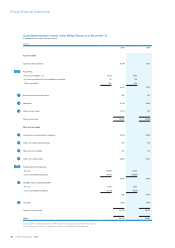
Composition of net debt to group equity
2004 2005
Long-term debt 3,552 3,320
Short-term debt 961 1,167
Total debt 4,513 4,487
Cash and cash equivalents (4,349 ) (5,293 )
Net debt (cash)
(total debt less cash and cash equivalents) 164 (806 )
Minority interests 283 332
Stockholders’ equity 14,860 16,666
Group equity 15,143 16,998
Net debt and group equity 15,307 16,192
Net debt divided by net debt and group equity (in %)
1 (5 )
Group equity divided by net debt and group
equity (in %) 99 105
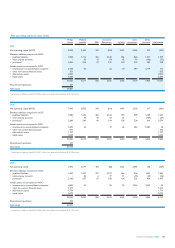
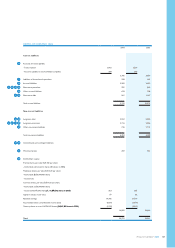
Sales growth composition
in % com-
parable
growth
currency
effects
consoli-
dation
changes
nominal
growth
2005 versus 2004
Medical Systems 6.7 0.5 0.6 7.8
DAP 5.9 1.5 − 7.4
Consumer Electronics 4.7 1.6 (1.2 ) 5.1
Lighting 4.0 1.1 0.4 5.5
Sub-total 5.2 1.2 (0.3) 6.1
Semiconductors 0.0 0.3 2.6 2.9
Other Activities (5.2 ) 0.2 (12.8 ) (17.8 )
Philips Group 3.6 1.0 (1.0 ) 3.6
2004 versus 2003
Medical Systems 3.9 (5.9 ) 0.2 (1.8 )
DAP (0.6 ) (3.5 ) − (4.1 )
Consumer Electronics 11.3 (4.0 ) 0.7 8.0
Lighting 5.1 (4.2 ) (0.8 ) 0.1
Sub-total 6.8 (4.5) 0.2 2.5
Semiconductors 18.0 (6.2 ) 3.7 15.5
Other Activities 17.7 (3.7 ) (2.1 ) 11.9
Philips Group 9.2 (4.7 ) 0.5 5.0
2003 versus 2002
Medical Systems 6.8 (12.7 ) (6.6 ) (12.5 )
DAP 3.0 (8.7 ) (0.5 ) (6.2 )
Consumer Electronics 2.3 (8.6 ) (0.5 ) (6.8 )
Lighting 2.4 (9.1 ) − (6.7 )
Sub-total 3.6 (9.8) (2.1) (8.3)
Semiconductors 3.6 (10.9 ) − (7.3 )
Other Activities (5.2 ) (6.3 ) (13.8 ) (25.3 )
Philips Group 2.9 (9.7 ) (3.0 ) (9.8 )
Management discussion and analysis
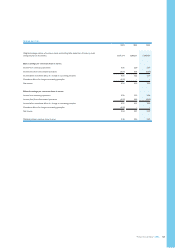
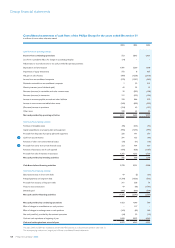
Composition of cash fl ows before fi nancing activities
2003 2004 2005
Cash fl ows from operating activities 2,012 2,623 2,090
Cash fl ows from investing activities 766 668 1,298
Cash fl ows before fi nancing activities 2,778 3,291 3,388