Philips 2005 Annual Report Download - page 182
Download and view the complete annual report
Please find page 182 of the 2005 Philips annual report below. You can navigate through the pages in the report by either clicking on the pages listed below, or by using the keyword search tool below to find specific information within the annual report.-
 1
1 -
2
-
3
-
4
-
5
-
6
-
7
-
8
-
9
-
10
-
11
-
12
-
13
-
14
-
15
-
16
-
17
-
18
-
19
-
20
-
21
-
22
-
23
-
24
-
25
-
26
-
27
-
28
-
29
-
30
-
31
-
32
-
33
-
34
-
35
-
36
-
37
-
38
-
39
-
40
-
41
-
42
-
43
-
44
-
45
-
46
-
47
-
48
-
49
-
50
-
51
-
52
-
53
-
54
-
55
-
56
-
57
-
58
-
59
-
60
-
61
-
62
-
63
-
64
-
65
-
66
-
67
-
68
-
69
-
70
-
71
-
72
-
73
-
74
-
75
-
76
-
77
-
78
-
79
-
80
-
81
-
82
-
83
-
84
-
85
-
86
-
87
-
88
-
89
-
90
-
91
-
92
-
93
-
94
-
95
-
96
-
97
-
98
-
99
-
100
-
101
-
102
-
103
-
104
-
105
-
106
-
107
-
108
-
109
-
110
-
111
-
112
-
113
-
114
-
115
-
116
-
117
-
118
-
119
-
120
-
121
-
122
-
123
-
124
-
125
-
126
-
127
-
128
-
129
-
130
-
131
-
132
-
133
-
134
-
135
-
136
-
137
-
138
-
139
-
140
-
141
-
142
-
143
-
144
-
145
-
146
-
147
-
148
-
149
-
150
-
151
-
152
-
153
-
154
-
155
-
156
-
157
-
158
-
159
-
160
-
161
-
162
-
163
-
164
-
165
-
166
-
167
-
168
-
169
-
170
-
171
-
 172
172 -
 173
173 -
 174
174 -
 175
175 -
 176
176 -
 177
177 -
 178
178 -
 179
179 -
 180
180 -
 181
181 -
 182
182 -
 183
183 -
 184
184 -
 185
185 -
 186
186 -
 187
187 -
 188
188 -
 189
189 -
 190
190 -
 191
191 -
 192
192 -
193
-
194
-
195
-
196
-
197
-
198
-
199
-
200
-
201
-
202
-
203
-
204
-
205
-
206
-
207
-
208
-
209
-
210
-
211
-
212
-
213
-
214
-
215
-
216
-
217
-
218
-
219
-
220
-
221
-
222
-
223
-
224
-
225
-
226
-
227
-
228
-
229
-
230
-
231
-
232
 |
 |

Philips Annual Report 2005182
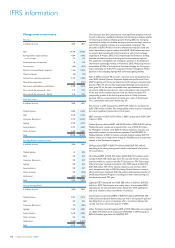
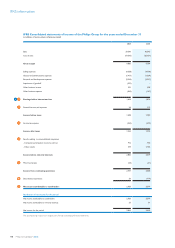
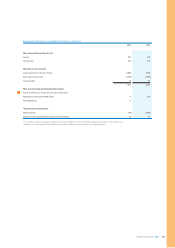
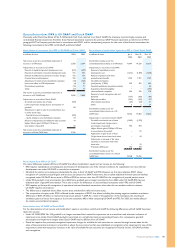
IFRS Consolidated statements of cash ows of the Philips Group for the years ended December 31
in millions of euros unless otherwise stated
2004 2005
Cashowsfromoperatingactivities:
Income before minority interests 2,800 3,579
Adjustments to reconcile net income to net cash provided by operating activities:
Depreciation and amortization 2,667 1,984
Impairment (reserval) of equity investments (11) 137
Net gain on sale of assets (1,187) (2,330)
Income from unconsolidated companies (1,226) (588)
Dividends received from unconsolidated companies 59 312
Dividends paid to minority shareholders (16) (16)
(Increase) in receivables and other current assets (327) (42)
(Increase) in inventories (153) (196)
Increase in accounts payable, accrued and other liabilities 821 227
Decrease (increase) in non-current receivables/other assets (233) 98
(Decrease) in provisions (16) (436)
Other items 62 58
Net cash provided by operating activities 3,240 2,787
Cashowsfrominvestingactivities:
Purchase of intangible assets (103) (92)
Expenditures on development assets (617) (697)
Capital expenditures on property, plant and equipment (1,269) (984)
Proceeds from disposals of property, plant and equipment 191 270
Cash from derivatives 125 (46)
Purchaseofothernon-currentnancialassets (11) (18)
Proceeds from other non-current assets 904 630
Purchase of businesses, net of cash acquired (438) (1,187)
Proceeds from sale of interests in businesses 1,273 2,738
Net cash provided by investing activities 55 614
Cash ows before nancing activities 3,295 3,401
Cashowsfromnancingactivities:
(Decrease) in short-term debt (5) (36)
Principal payments on long-term debt (1,924) (375)
Proceeds from issuance of long-term debt 258 74
Treasury stock transactions (18) (1,761)
Dividends paid (460) (504)
Net cash used for nancing activities (2,149) (2,602)
Net cash provided by continuing operations 1,146 799
Effect of changes in consolidations on cash positions 117 −
Effect of changes in exchange rates on cash positions (45) 160
Net cash provided by (used for) discontinued operations 59 (15)
Cash and cash equivalents at beginning of year 3,072 4,349
Cash and cash equivalents at end of year 4,349 5,293
Theaccompanyingnotesareanintegralpartoftheseconsolidatednancialstatements.
3131
3232
IFRS information