Philips 2005 Annual Report Download - page 176
Download and view the complete annual report
Please find page 176 of the 2005 Philips annual report below. You can navigate through the pages in the report by either clicking on the pages listed below, or by using the keyword search tool below to find specific information within the annual report.-
 1
1 -
2
-
3
-
4
-
5
-
6
-
7
-
8
-
9
-
10
-
11
-
12
-
13
-
14
-
15
-
16
-
17
-
18
-
19
-
20
-
21
-
22
-
23
-
24
-
25
-
26
-
27
-
28
-
29
-
30
-
31
-
32
-
33
-
34
-
35
-
36
-
37
-
38
-
39
-
40
-
41
-
42
-
43
-
44
-
45
-
46
-
47
-
48
-
49
-
50
-
51
-
52
-
53
-
54
-
55
-
56
-
57
-
58
-
59
-
60
-
61
-
62
-
63
-
64
-
65
-
66
-
67
-
68
-
69
-
70
-
71
-
72
-
73
-
74
-
75
-
76
-
77
-
78
-
79
-
80
-
81
-
82
-
83
-
84
-
85
-
86
-
87
-
88
-
89
-
90
-
91
-
92
-
93
-
94
-
95
-
96
-
97
-
98
-
99
-
100
-
101
-
102
-
103
-
104
-
105
-
106
-
107
-
108
-
109
-
110
-
111
-
112
-
113
-
114
-
115
-
116
-
117
-
118
-
119
-
120
-
121
-
122
-
123
-
124
-
125
-
126
-
127
-
128
-
129
-
130
-
131
-
132
-
133
-
134
-
135
-
136
-
137
-
138
-
139
-
140
-
141
-
142
-
143
-
144
-
145
-
146
-
147
-
148
-
149
-
150
-
151
-
152
-
153
-
154
-
155
-
156
-
157
-
158
-
159
-
160
-
161
-
162
-
163
-
164
-
165
-
 166
166 -
 167
167 -
 168
168 -
 169
169 -
 170
170 -
 171
171 -
 172
172 -
 173
173 -
 174
174 -
 175
175 -
 176
176 -
 177
177 -
 178
178 -
 179
179 -
 180
180 -
 181
181 -
 182
182 -
 183
183 -
 184
184 -
 185
185 -
 186
186 -
187
-
188
-
189
-
190
-
191
-
192
-
193
-
194
-
195
-
196
-
197
-
198
-
199
-
200
-
201
-
202
-
203
-
204
-
205
-
206
-
207
-
208
-
209
-
210
-
211
-
212
-
213
-
214
-
215
-
216
-
217
-
218
-
219
-
220
-
221
-
222
-
223
-
224
-
225
-
226
-
227
-
228
-
229
-
230
-
231
-
232
 |
 |

Philips Annual Report 2005176
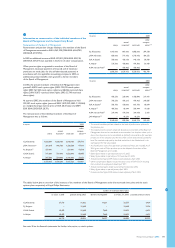
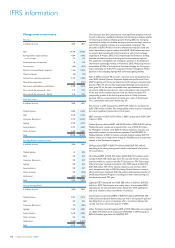
Management commentary
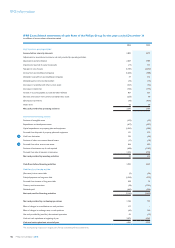
Key data
in millions of euros 2004 2005
Sales 29,346 30,395
Earnings before interest and tax 1,664 1,876
as a % of sales 5.7 6.2
Financial income and expenses 34 113
Income taxes (354) (615)
Results of unconsolidated companies 1,456 2,205
Minority interests (53) (31)
Income from continuing operations 2,747 3,548
Discontinued operations 36 (174)
Net income attributable to stockholders 2,783 3,374
Per common share (in euro) - basic 2.17 2.70
Per common share (in euro) - diluted 2.16 2.70
Sales per sector
in millions of euros 2004 2005
Medical Systems 5,884 6,343
DAP 2,044 2,194
Consumer Electronics 9,919 10,422
Lighting 4,526 4,775
Semiconductors 4,491 4,620
Other Activities 2,482 2,041
Total 29,346 30,395
Earnings before interest and tax
in millions of euros 2004 2005
Medical Systems 52 690
DAP 342 374
Consumer Electronics 359 527
Lighting 588 556
Semiconductors 558 457
Other Activities 392 (206)
Unallocated (627) (522)
Total 1,664 1,876
Net operating capital
in millions of euros 2004 2005
Medical Systems 2,762 3,274
DAP 474 474
Consumer Electronics (71) (200)
Lighting 1,549 2,846
Semiconductors 3,443 3,446
Other Activities 256 375
Unallocated (1,884) (2,307)
Total 6,529 7,908
Overthepastyear,theCompanyhasmadesignicantprogresstowards
its goal to become a healthcare, lifestyle and technology company capable
ofdeliveringsustainedprotablegrowth.During2005,theCompany
continued to realign its portfolio, exiting several non-strategic activities
and further reducing its stakes in unconsolidated companies. The
proceeds of EUR 3.4 billion from the divestments helped to fund two
share repurchase programs (under which EUR 1,836 million was used
to acquire approximately 84 million shares), as well as two strategic
acquisitions. In August 2005, the Company acquired Stentor, a leading
provider of medical picture archiving and communications systems.
The acquisition strengthens the Company’s position in the healthcare
information technology market. In November 2005, Philips acquired an
incremental 47.25% of the shares of Lumileds, bringing the Company’s
share ownership to 96.5%. This acquisition further strengthens Philips’
position in the emerging high-growth solid-state lighting market.
Sales in 2005 increased 4%, on both a nominal and a comparable basis,
over 2004. Medical Systems, Domestic Appliances and Personal Care
(DAP), Lighting, and Consumer Electronics (CE) achieved nominal sales
growth of 8%, 7%, 6%, and 5%, respectively. Although Semiconductors’
sales grew 3% for the year, comparable sales approximated the level
achieved in 2004. Semiconductors sales accelerated in the second half
of the year as the markets improved and the division achieved 9%
comparable growth in the fourth quarter. Sales in Other Activities
declined 18% on a nominal basis, primarily as a result of divestments.
On a comparable basis, sales declined by 5%.
Net income in 2005 amounted to EUR 3,374 million, as compared to
EUR 2,783 million in 2004. The comparability of the income is impacted
byseveralsignicanttransactionsinbothyears.
EBIT amounted to EUR 1,876 million in 2005, compared to EUR 1,664
million in 2004.
Medical Systems delivered EBIT of EUR 690 million (2004: EUR 52 million).
Medical Systems’ results were impacted by a loss of EUR 87 million
for MedQuist, of which some EUR 50 million related to (current and
expected) customer accommodation payments. The 2004 EBIT for
Medical Systems of EUR 52 million included charges totaling EUR 721
million related to an impairment charge for MedQuist and a settlement
related to the Volumetrics litigation.
DAP generated EBIT of EUR 374 million (2004: EUR 342 million),
benetingfromstrongsalesgrowthaidedbythelaunchofanumber
of new products.
CE achieved EBIT of EUR 527 million (2004: EUR 359 million), which
included a EUR 158 million gain from the sale and transfer of certain
activitieswithinitsmonitorsandatTVbusinesstoTPVTechnology.
Optical Licenses’ earnings, included in CE’s 2005 results, declined by
EUR 288 million; 70% of the decline related to past-use fees which
were exceptionally high in 2004. Excluding Optical Licenses’ income,
CE’sperformanceimprovedEUR456million,reectingthebenetsof
the Business Renewal Program, including prior-year restructuring and
the aforementioned TPV gain.
Lighting‘s EBIT decreased from EUR 588 million in 2004 to EUR 556
million in 2005. The decrease was mainly due to the increased R&D
expenditures for new products, lower demand for UHP applications
and costs related to the consolidation of Lumileds.
Semiconductors generated EBIT of EUR 457 million (2004: EUR 558
million).Semiconductorsnishedtheyearwithastrongfourthquarter,
benetingfromanupturninbusinessafteraslowrsthalf-yearthat
carried over from the fourth quarter of 2004.
Other Activities recorded negative EBIT of EUR 206 million as compared
toaEUR392millionprotachievedin2004.EBITin2004includeda
EUR 654 million gain from the NAVTEQ IPO.
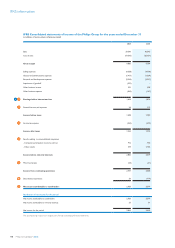
IFRS information