Philips 2005 Annual Report Download - page 200
Download and view the complete annual report
Please find page 200 of the 2005 Philips annual report below. You can navigate through the pages in the report by either clicking on the pages listed below, or by using the keyword search tool below to find specific information within the annual report.-
 1
1 -
2
-
3
-
4
-
5
-
6
-
7
-
8
-
9
-
10
-
11
-
12
-
13
-
14
-
15
-
16
-
17
-
18
-
19
-
20
-
21
-
22
-
23
-
24
-
25
-
26
-
27
-
28
-
29
-
30
-
31
-
32
-
33
-
34
-
35
-
36
-
37
-
38
-
39
-
40
-
41
-
42
-
43
-
44
-
45
-
46
-
47
-
48
-
49
-
50
-
51
-
52
-
53
-
54
-
55
-
56
-
57
-
58
-
59
-
60
-
61
-
62
-
63
-
64
-
65
-
66
-
67
-
68
-
69
-
70
-
71
-
72
-
73
-
74
-
75
-
76
-
77
-
78
-
79
-
80
-
81
-
82
-
83
-
84
-
85
-
86
-
87
-
88
-
89
-
90
-
91
-
92
-
93
-
94
-
95
-
96
-
97
-
98
-
99
-
100
-
101
-
102
-
103
-
104
-
105
-
106
-
107
-
108
-
109
-
110
-
111
-
112
-
113
-
114
-
115
-
116
-
117
-
118
-
119
-
120
-
121
-
122
-
123
-
124
-
125
-
126
-
127
-
128
-
129
-
130
-
131
-
132
-
133
-
134
-
135
-
136
-
137
-
138
-
139
-
140
-
141
-
142
-
143
-
144
-
145
-
146
-
147
-
148
-
149
-
150
-
151
-
152
-
153
-
154
-
155
-
156
-
157
-
158
-
159
-
160
-
161
-
162
-
163
-
164
-
165
-
166
-
167
-
168
-
169
-
170
-
171
-
172
-
173
-
174
-
175
-
176
-
177
-
178
-
179
-
180
-
181
-
182
-
183
-
184
-
185
-
186
-
187
-
188
-
189
-
 190
190 -
 191
191 -
 192
192 -
 193
193 -
 194
194 -
 195
195 -
 196
196 -
 197
197 -
 198
198 -
 199
199 -
 200
200 -
 201
201 -
 202
202 -
 203
203 -
 204
204 -
 205
205 -
 206
206 -
 207
207 -
 208
208 -
 209
209 -
 210
210 -
211
-
212
-
213
-
214
-
215
-
216
-
217
-
218
-
219
-
220
-
221
-
222
-
223
-
224
-
225
-
226
-
227
-
228
-
229
-
230
-
231
-
232
 |
 |

Philips Annual Report 2005200
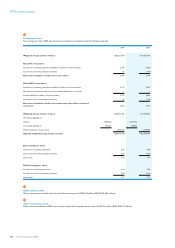
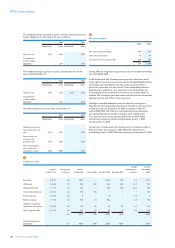
47
Earnings per share
The earnings per share (EPS) data have been calculated in accordance with the following schedule:
2004 2005
Weighted average number of shares 1,280,251,485 1,249,955,546
Basic EPS computation
Income from continuing operations available to holders of common shares 2,747 3,548
Income (loss) from discontinued operations 36 (174)
Net income available to holders of common shares 2,783 3,374
Diluted EPS computation
Income from continuing operations available to holders of common shares 2,747 3,548
Plus interest on assumed conversion of convertible debentures, net of taxes − −
Income available to holders of common shares 2,747 3,548
Income (loss) from discontinued operations 36 (174)
Net income available to holders of common shares plus effect of assumed
conversions 2,783 3,374
Weighted average number of shares 1,280,251,485 1,249,955,546
Plus shares applicable to:
Options 2,968,386 2,771,955
Convertible debentures 496,257 602,863
Dilutive potential common shares 3,464,643 3,374,818
Adjusted weighted average number of shares 1,283,716,128 1,253,330,364
Basic earnings per share:
Income from continuing operations 2.15 2.84
Income (loss) from discontinued operations 0.02 (0.14)
Net income 2.17 2.70
Diluted earnings per share:
Income from continuing operations 2.14 2.84
Income (loss) from discontinued operations 0.02 (0.14)
Net income 2.16 2.70
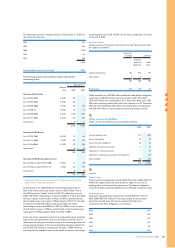
48
Other current assets
Other current assets include assets for derivative instruments of EUR 143 million (2004: EUR 523 million).
49
Other non-current assets
Other non-current assets in 2005 are primarily comprised of prepaid pension costs of EUR 95 million (2004: EUR 77 million).
IFRS information