Philips 2005 Annual Report Download - page 84
Download and view the complete annual report
Please find page 84 of the 2005 Philips annual report below. You can navigate through the pages in the report by either clicking on the pages listed below, or by using the keyword search tool below to find specific information within the annual report.-
 1
1 -
2
-
3
-
4
-
5
-
6
-
7
-
8
-
9
-
10
-
11
-
12
-
13
-
14
-
15
-
16
-
17
-
18
-
19
-
20
-
21
-
22
-
23
-
24
-
25
-
26
-
27
-
28
-
29
-
30
-
31
-
32
-
33
-
34
-
35
-
36
-
37
-
38
-
39
-
40
-
41
-
42
-
43
-
44
-
45
-
46
-
47
-
48
-
49
-
50
-
51
-
52
-
53
-
54
-
55
-
56
-
57
-
58
-
59
-
60
-
61
-
62
-
63
-
64
-
65
-
66
-
67
-
68
-
69
-
70
-
71
-
72
-
73
-
 74
74 -
 75
75 -
 76
76 -
 77
77 -
 78
78 -
 79
79 -
 80
80 -
 81
81 -
 82
82 -
 83
83 -
 84
84 -
 85
85 -
 86
86 -
 87
87 -
 88
88 -
 89
89 -
 90
90 -
 91
91 -
 92
92 -
 93
93 -
 94
94 -
95
-
96
-
97
-
98
-
99
-
100
-
101
-
102
-
103
-
104
-
105
-
106
-
107
-
108
-
109
-
110
-
111
-
112
-
113
-
114
-
115
-
116
-
117
-
118
-
119
-
120
-
121
-
122
-
123
-
124
-
125
-
126
-
127
-
128
-
129
-
130
-
131
-
132
-
133
-
134
-
135
-
136
-
137
-
138
-
139
-
140
-
141
-
142
-
143
-
144
-
145
-
146
-
147
-
148
-
149
-
150
-
151
-
152
-
153
-
154
-
155
-
156
-
157
-
158
-
159
-
160
-
161
-
162
-
163
-
164
-
165
-
166
-
167
-
168
-
169
-
170
-
171
-
172
-
173
-
174
-
175
-
176
-
177
-
178
-
179
-
180
-
181
-
182
-
183
-
184
-
185
-
186
-
187
-
188
-
189
-
190
-
191
-
192
-
193
-
194
-
195
-
196
-
197
-
198
-
199
-
200
-
201
-
202
-
203
-
204
-
205
-
206
-
207
-
208
-
209
-
210
-
211
-
212
-
213
-
214
-
215
-
216
-
217
-
218
-
219
-
220
-
221
-
222
-
223
-
224
-
225
-
226
-
227
-
228
-
229
-
230
-
231
-
232
 |
 |

Philips Annual Report 200584
Employment
Change in number of employees
in FTEs 2004 2005
Position at beginning of year 164,438 161,586
Consolidation changes:
- new consolidations 2,374 1,795
- deconsolidations (2,792 ) (2,552 )
Comparable change (2,434 ) (1,603 )
Position at year-end 161,586 159,226
At the end of December 2005, the total number of
employees of the Philips Group was 159,226 (including
MDS), a decline of 2,360 compared to December 31, 2004.
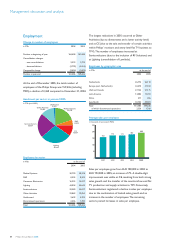
Headcount per sector at year-end 2005
in FTEs (excl. MDS)
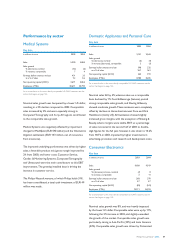
Medical Systems
30,978
DAP
8,203
CE
15,537
Lighting
45,649
Semiconductors
35,637
Other Activities
19,050
Unallocated
2,392
Employees by sector
in FTEs at the end of
2004 2005
Medical Systems 30,790 30,978
DAP 8,205 8,203
Consumer Electronics 16,993 15,537
Lighting 44,004 45,649
Semiconductors 32,580 35,637
Other Activities 23,869 19,050
Unallocated 2,609 2,392
Discontinued operations 2,536 1,780
Total 161,586 159,226
The largest reductions in 2005 occurred at Other
Activities (due to divestments and a lower activity level)
and at CE (due to the sale and transfer of certain activities
within Philips’ monitors and entry-level fl at TV business to
TPV). The number of employees increased at
Semiconductors (due to the inclusion of RF Solutions) and
at Lighting (consolidation of Lumileds).
Employees by geographic area
in FTEs at the end of
2004 2005
Netherlands 26,772 26,110
Europe (excl. Netherlands) 42,470 41,932
USA and Canada 27,144 27,175
Latin America 14,084 13,702
Africa 411 406
Asia Pacifi c 50,705 49,901
Total 161,586 159,226
of which discontinued operations 2,536 1,780
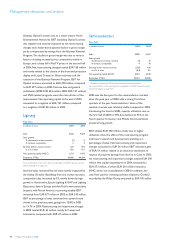
Average sales per employee
in thousands of euros (excl. MDS)
250
200
150
100
50
0
158
2001
172
2002
171
2003
180
2004
192
2005
Sales per employee grew from EUR 180,000 in 2004 to
EUR 192,000 in 2005, an increase of 7%. A double-digit
improvement was visible at CE, resulting from both strong
sales growth and the transfer of the monitors/low-end fl at
TV production and supply activities to TPV. Conversely,
Semiconductors registered a decline in sales per employee
due to the combination of limited sales growth and an
increase in the number of employees. The remaining
sectors posted increases in sales per employee.
Management discussion and analysis