Philips 2005 Annual Report Download - page 158
Download and view the complete annual report
Please find page 158 of the 2005 Philips annual report below. You can navigate through the pages in the report by either clicking on the pages listed below, or by using the keyword search tool below to find specific information within the annual report.-
 1
1 -
2
-
3
-
4
-
5
-
6
-
7
-
8
-
9
-
10
-
11
-
12
-
13
-
14
-
15
-
16
-
17
-
18
-
19
-
20
-
21
-
22
-
23
-
24
-
25
-
26
-
27
-
28
-
29
-
30
-
31
-
32
-
33
-
34
-
35
-
36
-
37
-
38
-
39
-
40
-
41
-
42
-
43
-
44
-
45
-
46
-
47
-
48
-
49
-
50
-
51
-
52
-
53
-
54
-
55
-
56
-
57
-
58
-
59
-
60
-
61
-
62
-
63
-
64
-
65
-
66
-
67
-
68
-
69
-
70
-
71
-
72
-
73
-
74
-
75
-
76
-
77
-
78
-
79
-
80
-
81
-
82
-
83
-
84
-
85
-
86
-
87
-
88
-
89
-
90
-
91
-
92
-
93
-
94
-
95
-
96
-
97
-
98
-
99
-
100
-
101
-
102
-
103
-
104
-
105
-
106
-
107
-
108
-
109
-
110
-
111
-
112
-
113
-
114
-
115
-
116
-
117
-
118
-
119
-
120
-
121
-
122
-
123
-
124
-
125
-
126
-
127
-
128
-
129
-
130
-
131
-
132
-
133
-
134
-
135
-
136
-
137
-
138
-
139
-
140
-
141
-
142
-
143
-
144
-
145
-
146
-
147
-
 148
148 -
 149
149 -
 150
150 -
 151
151 -
 152
152 -
 153
153 -
 154
154 -
 155
155 -
 156
156 -
 157
157 -
 158
158 -
 159
159 -
 160
160 -
 161
161 -
 162
162 -
 163
163 -
 164
164 -
 165
165 -
 166
166 -
 167
167 -
 168
168 -
169
-
170
-
171
-
172
-
173
-
174
-
175
-
176
-
177
-
178
-
179
-
180
-
181
-
182
-
183
-
184
-
185
-
186
-
187
-
188
-
189
-
190
-
191
-
192
-
193
-
194
-
195
-
196
-
197
-
198
-
199
-
200
-
201
-
202
-
203
-
204
-
205
-
206
-
207
-
208
-
209
-
210
-
211
-
212
-
213
-
214
-
215
-
216
-
217
-
218
-
219
-
220
-
221
-
222
-
223
-
224
-
225
-
226
-
227
-
228
-
229
-
230
-
231
-
232
 |
 |

Philips Annual Report 2005158
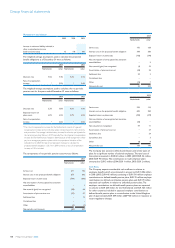
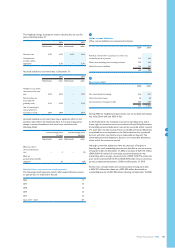
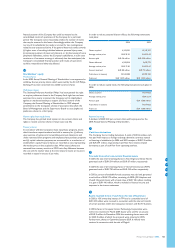
Movements in net balances
2003 2004 2005
Increase in minimum liability, included in
other comprehensive income
(before income taxes) 13 118 181
The weighted average assumptions used to calculate the projected
benetobligationsasofDecember31wereasfollows:
2004 2005
Netherlands other Netherlands other
Discount rate 4.5% 5.4% 4.2% 5.1%
Rate of compensation
increase *3.5% *3.4%
The weighted-average assumptions used to calculate the net periodic
pension cost for the years ended December 31 were as follows:
2004 2005
Netherlands other Netherlands other
Discount rate 5.3% 5.8% 4.5% 5.4%
Expected returns on
plans assets 6.0% 6.5% 5.7% 6.5%
Rate of compensation
increase *3.6% *3.5%
* The rate of compensation increase for the Netherlands consists of a general
compensation increase and an individual salary increase based on merit, seniority
and promotion. The average individual salary increase for all active participants for
the remaining working lifetime is 0.75% annually. The rate of general compensation
increasefortheNetherlandschangedin2004becauseofthechangefromanal-
pay to an average-pay pension system which incorporates a limitation of the
indexation. Until 2008 the rate of compensation increase to calculate the
projectedbenetobligationis2%.From2008onwardsarateofcompensation
increase of 1% is included.
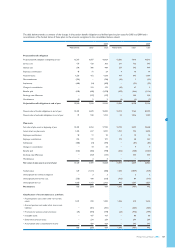
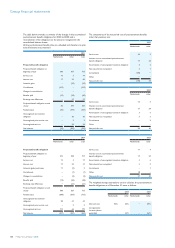
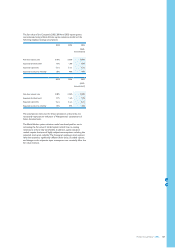
The components of net periodic pension costs were as follows:
2005
Netherlands other
Service cost 211 132
Interestcostontheprojectedbenetobligation 557 392
Expected return on plan assets (739) (360)
Net amortization of unrecognized net transition
assets/liabilities −1
Net actuarial (gain) loss recognized (28) 44
Amortization of prior-service cost (57) 27
Settlement loss −12
Curtailment loss − −
Other (4) (1)
Net periodic cost (income) (60) 247
2004
Netherlands other
Service cost 175 128
Interestcostontheprojectedbenetobligation 598 386
Expected return on plan assets (726) (370)
Net amortization of unrecognized net transition
assets/liabilities −5
Net actuarial (gain) loss recognized (1) 19
Amortization of prior-service cost (43) 26
Settlement loss 34 3
Curtailment loss − −
Other (12) 7
Net periodic cost 25 204
2003
Netherlands other
Service cost 229 116
Interestcostontheprojectedbenetobligation 683 384
Expected return on plan assets (700) (377)
Net amortization of unrecognized net transition
assets/liabilities (55) −
Net actuarial loss recognized 49 11
Amortization of prior-service cost −27
Settlement loss −24
Curtailment loss −3
Other (8) 8
Net periodic cost 198 196
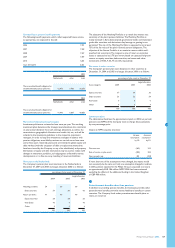
TheCompanyalsosponsorsdened-contributionandsimilartypesof
plansforasignicantnumberofsalariedemployees.Thetotalcostof
these plans amounted to EUR 68 million in 2005 (2004: EUR 54 million,
2003: EUR 46 million). The contributions to multi-employer plans
amounted to EUR 3 million (2004: EUR 1 million, 2003: EUR 2 million).
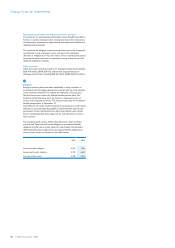
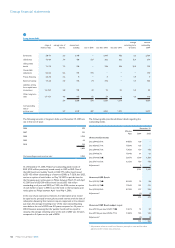
Cashows
TheCompanyexpectsconsiderablecashoutowsinrelationto
employeebenetswhichareestimatedtoamounttoEUR1,086million
in 2006 (2005: EUR 445 million), consisting of EUR 931 million employer
contributionstodened-benetpensionplans,EUR76millionemployer
contributionstodened-contributionpensionplans,andEUR79million
expectedcashoutowsinrelationtounfundedpensionplans.The
employercontributionstodened-benetpensionplansareexpected
to amount to EUR 208 million for the Netherlands and EUR 723 million
for other countries. Included in expected employer contributions to
dened-benetpensionplansisacontributiontotheUnitedKingdom
plan of approximately EUR 584 million (GBP 400 million) in response to
recent regulatory changes.
Groupnancialstatements