Philips 2005 Annual Report Download - page 7
Download and view the complete annual report
Please find page 7 of the 2005 Philips annual report below. You can navigate through the pages in the report by either clicking on the pages listed below, or by using the keyword search tool below to find specific information within the annual report.-
 1
1 -
 2
2 -
 3
3 -
 4
4 -
 5
5 -
 6
6 -
 7
7 -
 8
8 -
 9
9 -
 10
10 -
 11
11 -
 12
12 -
 13
13 -
 14
14 -
 15
15 -
 16
16 -
 17
17 -
 18
18 -
19
-
20
-
21
-
22
-
23
-
24
-
25
-
26
-
27
-
28
-
29
-
30
-
31
-
32
-
33
-
34
-
35
-
36
-
37
-
38
-
39
-
40
-
41
-
42
-
43
-
44
-
45
-
46
-
47
-
48
-
49
-
50
-
51
-
52
-
53
-
54
-
55
-
56
-
57
-
58
-
59
-
60
-
61
-
62
-
63
-
64
-
65
-
66
-
67
-
68
-
69
-
70
-
71
-
72
-
73
-
74
-
75
-
76
-
77
-
78
-
79
-
80
-
81
-
82
-
83
-
84
-
85
-
86
-
87
-
88
-
89
-
90
-
91
-
92
-
93
-
94
-
95
-
96
-
97
-
98
-
99
-
100
-
101
-
102
-
103
-
104
-
105
-
106
-
107
-
108
-
109
-
110
-
111
-
112
-
113
-
114
-
115
-
116
-
117
-
118
-
119
-
120
-
121
-
122
-
123
-
124
-
125
-
126
-
127
-
128
-
129
-
130
-
131
-
132
-
133
-
134
-
135
-
136
-
137
-
138
-
139
-
140
-
141
-
142
-
143
-
144
-
145
-
146
-
147
-
148
-
149
-
150
-
151
-
152
-
153
-
154
-
155
-
156
-
157
-
158
-
159
-
160
-
161
-
162
-
163
-
164
-
165
-
166
-
167
-
168
-
169
-
170
-
171
-
172
-
173
-
174
-
175
-
176
-
177
-
178
-
179
-
180
-
181
-
182
-
183
-
184
-
185
-
186
-
187
-
188
-
189
-
190
-
191
-
192
-
193
-
194
-
195
-
196
-
197
-
198
-
199
-
200
-
201
-
202
-
203
-
204
-
205
-
206
-
207
-
208
-
209
-
210
-
211
-
212
-
213
-
214
-
215
-
216
-
217
-
218
-
219
-
220
-
221
-
222
-
223
-
224
-
225
-
226
-
227
-
228
-
229
-
230
-
231
-
232
 |
 |

Philips Annual Report 2005 7
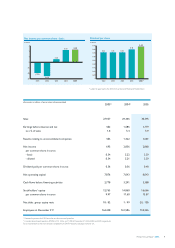
all amounts in millions of euros unless otherwise stated
20031) 20041) 2005
Sales 27,937 29,346 30,395
Earnings before interest and tax 502 1,586 1,779
as a % of sales 1.8 5.4 5.9
Results relating to unconsolidated companies 506 1,422 1,681
Net income 695 2,836 2,868
per common share in euros
- basic 0.54 2.22 2.29
- diluted 0.54 2.21 2.29
Dividend paid per common share in euros 0.36 0.36 0.40
Net operating capital 7,876 7,043 8,043
Cash fl ows before fi nancing activities 2,778 3,291 3,388
Stockholders’ equity 12,763 14,860 16,666
per common share in euros 9.97 11.60 13.87
Net debt : group equity ratio 18 : 82 1 : 99 (5) : 105
Employees at December 312) 164,438 161,586 159,226
1) Restated to present the MDS activities as a discontinued operation
2) Includes discontinued operation (MDS): 2,414, 2,536 and 1,780 at December 31, 2003, 2004 and 2005, respectively
For a reconciliation to the most directly comparable US GAAP measures, see pages 120 and 121.
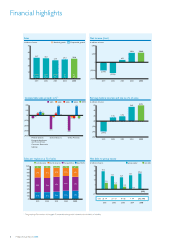
Net income per common share - basic
(3)
(2)
(1)
0
1
2
3
2001 2002 2003 2004 2005
in euros
(1.94)
(2.51)
0.54
2.22 2.29
Dividend per share
0
0.05
0.10
0.15
0.20
0.25
0.30
0.35
0.40
0.45
0.36
2002
0.36
2003
0.36
2004
0.40
2005 2006*
in euros
0.44
* subject to approval by the 2006 Annual General Meeting of Shareholders