Philips 2005 Annual Report Download - page 113
Download and view the complete annual report
Please find page 113 of the 2005 Philips annual report below. You can navigate through the pages in the report by either clicking on the pages listed below, or by using the keyword search tool below to find specific information within the annual report.-
 1
1 -
2
-
3
-
4
-
5
-
6
-
7
-
8
-
9
-
10
-
11
-
12
-
13
-
14
-
15
-
16
-
17
-
18
-
19
-
20
-
21
-
22
-
23
-
24
-
25
-
26
-
27
-
28
-
29
-
30
-
31
-
32
-
33
-
34
-
35
-
36
-
37
-
38
-
39
-
40
-
41
-
42
-
43
-
44
-
45
-
46
-
47
-
48
-
49
-
50
-
51
-
52
-
53
-
54
-
55
-
56
-
57
-
58
-
59
-
60
-
61
-
62
-
63
-
64
-
65
-
66
-
67
-
68
-
69
-
70
-
71
-
72
-
73
-
74
-
75
-
76
-
77
-
78
-
79
-
80
-
81
-
82
-
83
-
84
-
85
-
86
-
87
-
88
-
89
-
90
-
91
-
92
-
93
-
94
-
95
-
96
-
97
-
98
-
99
-
100
-
101
-
102
-
 103
103 -
 104
104 -
 105
105 -
 106
106 -
 107
107 -
 108
108 -
 109
109 -
 110
110 -
 111
111 -
 112
112 -
 113
113 -
 114
114 -
 115
115 -
 116
116 -
 117
117 -
 118
118 -
 119
119 -
 120
120 -
 121
121 -
 122
122 -
 123
123 -
124
-
125
-
126
-
127
-
128
-
129
-
130
-
131
-
132
-
133
-
134
-
135
-
136
-
137
-
138
-
139
-
140
-
141
-
142
-
143
-
144
-
145
-
146
-
147
-
148
-
149
-
150
-
151
-
152
-
153
-
154
-
155
-
156
-
157
-
158
-
159
-
160
-
161
-
162
-
163
-
164
-
165
-
166
-
167
-
168
-
169
-
170
-
171
-
172
-
173
-
174
-
175
-
176
-
177
-
178
-
179
-
180
-
181
-
182
-
183
-
184
-
185
-
186
-
187
-
188
-
189
-
190
-
191
-
192
-
193
-
194
-
195
-
196
-
197
-
198
-
199
-
200
-
201
-
202
-
203
-
204
-
205
-
206
-
207
-
208
-
209
-
210
-
211
-
212
-
213
-
214
-
215
-
216
-
217
-
218
-
219
-
220
-
221
-
222
-
223
-
224
-
225
-
226
-
227
-
228
-
229
-
230
-
231
-
232
 |
 |
Philips Annual Report 2005 113
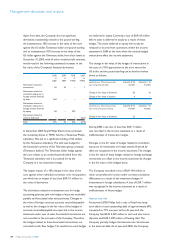
even big enough to cause a change in sign compared to
2004. This is related to the fact that the impact of interest
rate increases on NPPC for the UK is reduced by some
non-linearities in the recognition of gains and losses in
accordance with the applicable accounting standards.
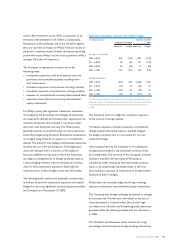
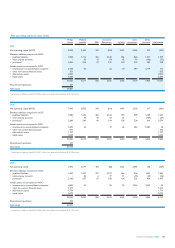
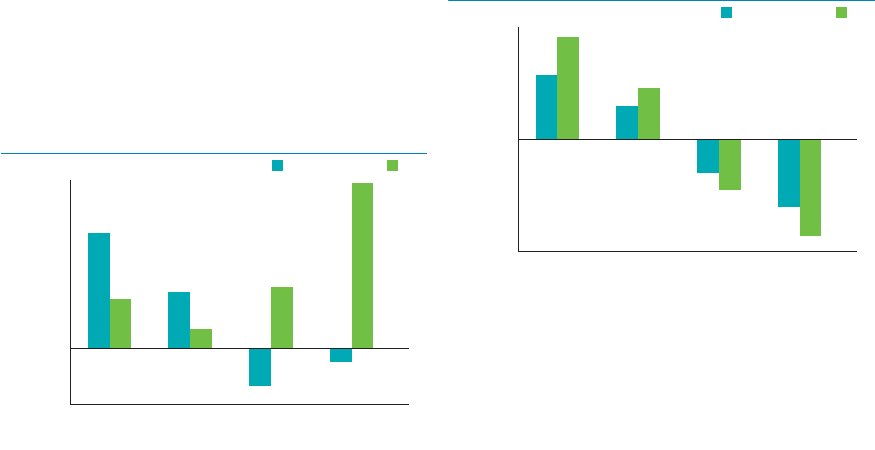
Sensitivity of the net periodic pension cost to
simultaneous changes in interest rates and discount rates
2004 2005
Change in NPPC
(compared to total NPPC)
Change in interest rate
12%
10%
8%
6%
4%
2%
0%
(2%)
(4%)
(1.0%) (0.5%) 0.5% 1.0%
As the effects on interest cost and service costs from
changes in interest rates partially offset each other, and
changes in equity valuations do not affect either of them,
the interest rate and equity price sensitivities of NPPC are
largely determined by the sensitivities of the expected
returns on assets and the amortizations of unrecognised
gains and losses. Moreover, where these sensitivities have
opposite signs for changes in interest rates, they come on
top of each other for changes in equity valuations.
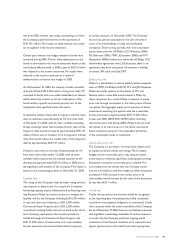
Consequently, the impact of changes in equity prices on
NPPC clearly exceeds that of changes in interest rates.
As with the impact of interest rate changes, the impact of
changes in equity valuations on NPPC is the largest for the
Netherlands, where equity investments compared to the
Company’s total pension liabilities are largest. Declines
(increases) in equity prices lead to signifi cantly higher (lower)
NPPC levels. The increase in plan assets in 2005 compared
to 2004 and the resultant increase in the absolute sizes of
any percentage change in equity valuations as well as the
decline in estimated NPPC for 2006 compared to 2005
imply an increased sensitivity of NPPC to changes in
equity prices.
Sensitivity of the net periodic pension cost to changes in
equity valuations
2004 2005
Change in NPPC
(compared to total NPPC)
Change in equity valuations
80%
60%
40%
20%
0%
(20%)
(40%)
(60%)
(80%)
(20%) (10%) 10% 20%
While the exposure of the balance sheet to pension risk
has changed only minimally, the income statement has
become somewhat more exposed to it. This is largely
due to increased assets and liabilities. In percentage terms,
the increased sensitivity also results from the decline in
expected NPPC. Plan changes and changes in investment
policies have not been signifi cant enough to cause material
effects in this respect.
Fiscal
Philips is, as mentioned before, exposed to fi scal risks.
This section further describes this exposure.
Transfer pricing risks
Philips has issued transfer pricing directives, which are in
accordance with guidelines of the Organization of Economic
Co-operation and Development. As transfer pricing has
a cross-border effect, the focus of local tax authorities on
implemented transfer pricing procedures in a country may
have an impact on results in another country. In order to
mitigate the transfer pricing risks, audits are executed on
a regular basis to safeguard the correct implementation of
the transfer pricing directives.
Tax risk on general service agreements
Due to the centralization of certain activities in a limited
number of countries (such as research and development
costs, centralized costs for IT, and costs for corporate
functions and head offi ce) costs are also centralized. As a
consequence, for tax reasons these costs must be allocated
to the benefi ciaries, being the various Philips entities. For
that purpose general service agreements (GSAs) are
signed with a large number of entities. Tax authorities
review the implementation of GSAs, often auditing on
benefi t test for a particular country or the use of tax
credits attached to GSAs and royalty payments, and may