Philips 2005 Annual Report Download - page 128
Download and view the complete annual report
Please find page 128 of the 2005 Philips annual report below. You can navigate through the pages in the report by either clicking on the pages listed below, or by using the keyword search tool below to find specific information within the annual report.-
 1
1 -
2
-
3
-
4
-
5
-
6
-
7
-
8
-
9
-
10
-
11
-
12
-
13
-
14
-
15
-
16
-
17
-
18
-
19
-
20
-
21
-
22
-
23
-
24
-
25
-
26
-
27
-
28
-
29
-
30
-
31
-
32
-
33
-
34
-
35
-
36
-
37
-
38
-
39
-
40
-
41
-
42
-
43
-
44
-
45
-
46
-
47
-
48
-
49
-
50
-
51
-
52
-
53
-
54
-
55
-
56
-
57
-
58
-
59
-
60
-
61
-
62
-
63
-
64
-
65
-
66
-
67
-
68
-
69
-
70
-
71
-
72
-
73
-
74
-
75
-
76
-
77
-
78
-
79
-
80
-
81
-
82
-
83
-
84
-
85
-
86
-
87
-
88
-
89
-
90
-
91
-
92
-
93
-
94
-
95
-
96
-
97
-
98
-
99
-
100
-
101
-
102
-
103
-
104
-
105
-
106
-
107
-
108
-
109
-
110
-
111
-
112
-
113
-
114
-
115
-
116
-
117
-
 118
118 -
 119
119 -
 120
120 -
 121
121 -
 122
122 -
 123
123 -
 124
124 -
 125
125 -
 126
126 -
 127
127 -
 128
128 -
 129
129 -
 130
130 -
 131
131 -
 132
132 -
 133
133 -
 134
134 -
 135
135 -
 136
136 -
 137
137 -
 138
138 -
139
-
140
-
141
-
142
-
143
-
144
-
145
-
146
-
147
-
148
-
149
-
150
-
151
-
152
-
153
-
154
-
155
-
156
-
157
-
158
-
159
-
160
-
161
-
162
-
163
-
164
-
165
-
166
-
167
-
168
-
169
-
170
-
171
-
172
-
173
-
174
-
175
-
176
-
177
-
178
-
179
-
180
-
181
-
182
-
183
-
184
-
185
-
186
-
187
-
188
-
189
-
190
-
191
-
192
-
193
-
194
-
195
-
196
-
197
-
198
-
199
-
200
-
201
-
202
-
203
-
204
-
205
-
206
-
207
-
208
-
209
-
210
-
211
-
212
-
213
-
214
-
215
-
216
-
217
-
218
-
219
-
220
-
221
-
222
-
223
-
224
-
225
-
226
-
227
-
228
-
229
-
230
-
231
-
232
 |
 |

Philips Annual Report 2005128
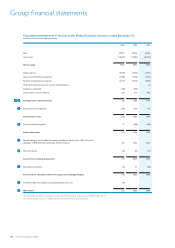
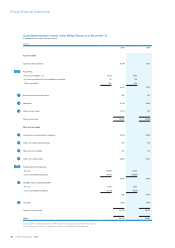
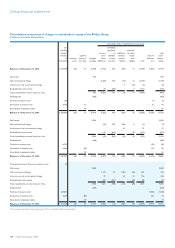
Consolidated statements of cash ows of the Philips Group for the years ended December 31
in millions of euros unless otherwise stated
2003 2004 2005
Cashowsfromoperatingactivities:
Income from continuing operations 723 2,815 2,951
Loss from a cumulative effect of a change in accounting principles (14) − −
Adjustments to reconcile income to net cash provided by operating activities:
Depreciation and amortization 1,981 2,260 1,508
Impairment of equity investments 772 8 427
Net gain on sale of assets (989) (1,328) (2,118)
Income from unconsolidated companies (570) (1,237) (563)
Dividends received from unconsolidated companies 1 59 312
Minority interests (net of dividends paid) 49 35 15
Decrease (increase) in receivables and other current assets 39 (359) (198)
Decrease (increase) in inventories 111 (153) (196)
Increase in accounts payable, accrued and other liabilities 198 846 279
Increase in non-current receivables/other assets (243) (435) (250)
(Decrease) increase in provisions (154) 49 (127)
Other items 108 63 50
Net cash provided by operating activities 2,012 2,623 2,090
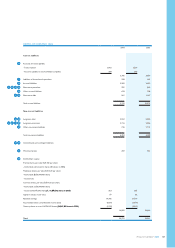
Cashowsfrominvestingactivities:
Purchase of intangible assets (96) (103) (92)
Capital expenditures on property, plant and equipment (956) (1,273) (997)
Proceeds from disposals of property, plant and equipment 220 191 270
Cash from (to) derivatives 391 125 (46)
Purchaseofothernon-currentnancialassets (18) (11) (18)
Proceedsfromothernon-currentnancialassets 323 904 630
Purchase of businesses, net of cash acquired (470) (438) (1,187)
Proceeds from sale of interests in businesses 1,372 1,273 2,738
Net cash provided by investing activities 766 668 1,298
Cash ows before nancing activities 2,778 3,291 3,388
Cashowsfromnancingactivities:
(Decrease) increase in short-term debt 49 (5) (36)
Principal payments on long-term debt (1,304) (1,920) (362)
Proceeds from issuance of long-term debt 311 258 74
Treasury stock transactions 49 (18) (1,761)
Dividends paid (460) (460) (504)
Net cash used for nancing activities (1,355) (2,145) (2,589)
Net cash provided by continuing operations 1,423 1,146 799
Effect of changes in consolidations on cash positions −117 −
Effect of changes in exchange rates on cash positions (165) (45) 160
Net cash (used for) provided by discontinued operations (44) 59 (15)
Cash and cash equivalents at beginning of year 1,858 3,072 4,349
Cash and cash equivalents at end of year 3,072 4,349 5,293
The years 2003 and 2004 are restated to present the MDS business as a discontinued operation (see note 1).
Theaccompanyingnotesareanintegralpartoftheseconsolidatednancialstatements.
3131
3232
Groupnancialstatements