Philips 2005 Annual Report Download - page 76
Download and view the complete annual report
Please find page 76 of the 2005 Philips annual report below. You can navigate through the pages in the report by either clicking on the pages listed below, or by using the keyword search tool below to find specific information within the annual report.-
 1
1 -
2
-
3
-
4
-
5
-
6
-
7
-
8
-
9
-
10
-
11
-
12
-
13
-
14
-
15
-
16
-
17
-
18
-
19
-
20
-
21
-
22
-
23
-
24
-
25
-
26
-
27
-
28
-
29
-
30
-
31
-
32
-
33
-
34
-
35
-
36
-
37
-
38
-
39
-
40
-
41
-
42
-
43
-
44
-
45
-
46
-
47
-
48
-
49
-
50
-
51
-
52
-
53
-
54
-
55
-
56
-
57
-
58
-
59
-
60
-
61
-
62
-
63
-
64
-
65
-
 66
66 -
 67
67 -
 68
68 -
 69
69 -
 70
70 -
 71
71 -
 72
72 -
 73
73 -
 74
74 -
 75
75 -
 76
76 -
 77
77 -
 78
78 -
 79
79 -
 80
80 -
 81
81 -
 82
82 -
 83
83 -
 84
84 -
 85
85 -
 86
86 -
87
-
88
-
89
-
90
-
91
-
92
-
93
-
94
-
95
-
96
-
97
-
98
-
99
-
100
-
101
-
102
-
103
-
104
-
105
-
106
-
107
-
108
-
109
-
110
-
111
-
112
-
113
-
114
-
115
-
116
-
117
-
118
-
119
-
120
-
121
-
122
-
123
-
124
-
125
-
126
-
127
-
128
-
129
-
130
-
131
-
132
-
133
-
134
-
135
-
136
-
137
-
138
-
139
-
140
-
141
-
142
-
143
-
144
-
145
-
146
-
147
-
148
-
149
-
150
-
151
-
152
-
153
-
154
-
155
-
156
-
157
-
158
-
159
-
160
-
161
-
162
-
163
-
164
-
165
-
166
-
167
-
168
-
169
-
170
-
171
-
172
-
173
-
174
-
175
-
176
-
177
-
178
-
179
-
180
-
181
-
182
-
183
-
184
-
185
-
186
-
187
-
188
-
189
-
190
-
191
-
192
-
193
-
194
-
195
-
196
-
197
-
198
-
199
-
200
-
201
-
202
-
203
-
204
-
205
-
206
-
207
-
208
-
209
-
210
-
211
-
212
-
213
-
214
-
215
-
216
-
217
-
218
-
219
-
220
-
221
-
222
-
223
-
224
-
225
-
226
-
227
-
228
-
229
-
230
-
231
-
232
 |
 |
Philips Annual Report 200576
Domestic Appliances
and Personal Care
Key data
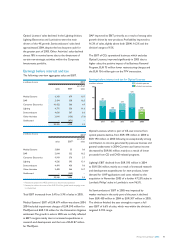
in millions of euros 2003 2004 2005
Sales 2,131 2,044 2,194
Sales growth
% increase (decrease), nominal (6 ) (4 ) 7
% increase (decrease), comparable 3 (1 ) 6
Earnings before interest and tax 398 332 358
as a % of sales 18.7 16.2 16.3
Net operating capital (NOC) 464 393 370
Cash fl ows before fi nancing activities 417 393 418
Employees (FTEs) 8,180 8,205 8,203
For a reconciliation to the most directly comparable US GAAP measures, see the
section that begins on page 120.
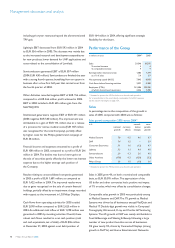
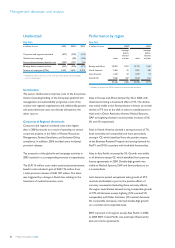
Sales and net operating capital
in billions of euros sales NOC
3
2
1
0
2001 2002 2003 2004 2005
2.2 2.3
2.1 2.0
2.2
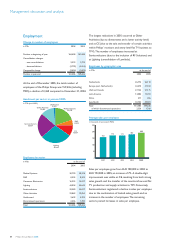
Earnings before interest and tax
in millions of euros as a % of sales
500
400
300
200
100
0
20%
18%
16%
14%
12%
10%
2001 2002 2003 2004 2005
334
401
398
332 358
Market developments
Overall, relevant Western European and North American
markets were stable, while Eastern Europe, Japan and China
showed double-digit growth. The Western European market
for drip-fi lter coffee makers grew considerably, driven by
consumer demand for innovative coffee makers like the
Senseo product range. DAP’s market share in most product
categories remained stable.
Business developments
DAP intends to achieve sustainable leadership positions
in selected innovative domestic and lifestyle appliance
categories. The division strives to achieve this by offering
technologically advanced products which are designed
around the consumer and easy to use. Philips has further
developed a new Consumer Health & Wellness group to
develop products and services that diagnose, monitor,
improve and care for consumer health and well-being.
Financial performance
Full-year sales grew by 7% on a nominal basis, and 6% on
a comparable basis. Nominal sales growth was mainly
driven by a 7% increase at Shaving & Beauty (attributable
to new SmartTouch/Speed-XL shavers and new hair care
products) and a 15% increase at Food & Beverage (driven
by Senseo, food appliances and PerfectDraft). Home
Environment Care posted 5% growth, driven by the new
vacuum cleaner line. In spite of a growing market share
in the US, Oral Healthcare sales declined by 1%, mainly
due to strong competition in Europe.
R esearch and development expenditures increased in the
Consumer Health & Wellness group.
EBIT amounted to EUR 358 million, or 16.3% of sales, slightly
above 2004’s level and the division’s target of 15%.
Management discussion and analysis