Philips 2005 Annual Report Download - page 196
Download and view the complete annual report
Please find page 196 of the 2005 Philips annual report below. You can navigate through the pages in the report by either clicking on the pages listed below, or by using the keyword search tool below to find specific information within the annual report.-
 1
1 -
2
-
3
-
4
-
5
-
6
-
7
-
8
-
9
-
10
-
11
-
12
-
13
-
14
-
15
-
16
-
17
-
18
-
19
-
20
-
21
-
22
-
23
-
24
-
25
-
26
-
27
-
28
-
29
-
30
-
31
-
32
-
33
-
34
-
35
-
36
-
37
-
38
-
39
-
40
-
41
-
42
-
43
-
44
-
45
-
46
-
47
-
48
-
49
-
50
-
51
-
52
-
53
-
54
-
55
-
56
-
57
-
58
-
59
-
60
-
61
-
62
-
63
-
64
-
65
-
66
-
67
-
68
-
69
-
70
-
71
-
72
-
73
-
74
-
75
-
76
-
77
-
78
-
79
-
80
-
81
-
82
-
83
-
84
-
85
-
86
-
87
-
88
-
89
-
90
-
91
-
92
-
93
-
94
-
95
-
96
-
97
-
98
-
99
-
100
-
101
-
102
-
103
-
104
-
105
-
106
-
107
-
108
-
109
-
110
-
111
-
112
-
113
-
114
-
115
-
116
-
117
-
118
-
119
-
120
-
121
-
122
-
123
-
124
-
125
-
126
-
127
-
128
-
129
-
130
-
131
-
132
-
133
-
134
-
135
-
136
-
137
-
138
-
139
-
140
-
141
-
142
-
143
-
144
-
145
-
146
-
147
-
148
-
149
-
150
-
151
-
152
-
153
-
154
-
155
-
156
-
157
-
158
-
159
-
160
-
161
-
162
-
163
-
164
-
165
-
166
-
167
-
168
-
169
-
170
-
171
-
172
-
173
-
174
-
175
-
176
-
177
-
178
-
179
-
180
-
181
-
182
-
183
-
184
-
185
-
 186
186 -
 187
187 -
 188
188 -
 189
189 -
 190
190 -
 191
191 -
 192
192 -
 193
193 -
 194
194 -
 195
195 -
 196
196 -
 197
197 -
 198
198 -
 199
199 -
 200
200 -
 201
201 -
 202
202 -
 203
203 -
 204
204 -
 205
205 -
 206
206 -
207
-
208
-
209
-
210
-
211
-
212
-
213
-
214
-
215
-
216
-
217
-
218
-
219
-
220
-
221
-
222
-
223
-
224
-
225
-
226
-
227
-
228
-
229
-
230
-
231
-
232
 |
 |

Philips Annual Report 2005196
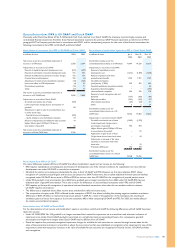
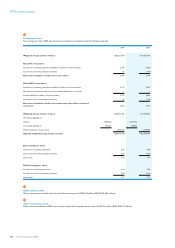
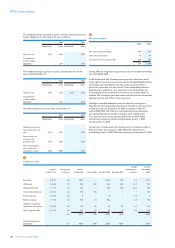
Interest income increased to EUR 92 million during 2005; this was
mainly as a result of the higher average cash position of the Group
during 2005.
Incomefromnon-currentnancialassetsin2005includedEUR235
million of tax-exempt gains on the sale of the remaining shares in Atos
Origin and Great Nordic. In 2004 this included EUR 238 million of tax-
exempt gains on the sale of the remaining shares in ASML (EUR 140
million) and Vivendi Universal (EUR 98 million).
As a result of an increase in the fair value of available-for-sale securities
in 2004 (mainly Great Nordic shares), prior-year impairments were
reversed,leadingtoanancialincomeofEUR19million.
Miscellaneousnancingcosts/incomein2005includedafairvaluegain
on the share option within the convertible bond that was received in
connection with the sale and transfer of certain activities within the
Company’smonitorandatTVbusinesstoTPV.Refertonote41.
Miscellaneousnancingcostsin2004includedincomeofEUR46million,
representing interest recognized as a result of a favorable resolution of
scalaudits.
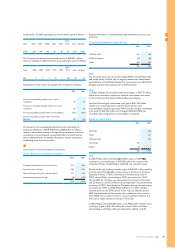
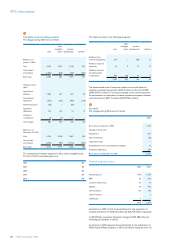
44
Income taxes
The tax expense on income before tax amounted to EUR 615 million in
2005 (2004: tax expense EUR 354 million). TSMC shares held by Philips
in Taiwan were transferred to Philips in the Netherlands to improve the
efciencyoffuturedisposals.This resulted in a withholding tax expense
of EUR 240 million in 2005.
The components of income before taxes are as follows:
2004 2005
Netherlands 874 744
Foreign 824 1,245
Income before taxes 1,698 1,989
The components of income tax expense are as follows:
Netherlands:
Current taxes (46) 3
Deferred taxes (154) (123)
(200) (120)
Foreign:
Current taxes (254) (488)
Deferred taxes 100 (7)
(154) (495)
Incometax(expense)benetfromcontinuingoperations (354) (615)
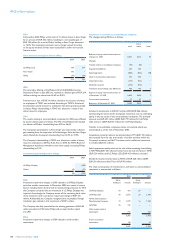
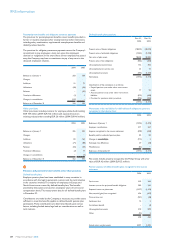
Philips’ operations are subject to income taxes in various foreign
jurisdictions. Besides tax incentives, the statutory income tax rates
vary from 12.5% to 41.0%, which causes a difference between the
weighted average statutory income tax rate and the Netherlands’
statutory income tax rate of 31.5%. A reconciliation of the weighted
average statutory income tax rate as a percentage of income before
taxes and the effective income tax rate is as follows:
2004 2005
Weighted average statutory income tax rate 34.1 33.4
Tax effect of:
Changes related to:
utilization of previously reserved loss carryforwards• (1.1) (2.5)
new loss carryforwards not expected to be realized• (2.7) 4.4
releases and other changes• (1.4) (7.9)
Non-tax-deductible impairment charges 12.0 −
Non-taxable income (27.1) (8.6)
Non-tax-deductible expenses 2.3 3.9
Withholding and other taxes 0.7 12.9
Tax incentives and other 4.0 (4.7)
Effective tax rate 20.8 30.9
In the reconciliation of the weighted average statutory income tax rate
as a percentage of total income before taxes and the effective tax rate,
non-taxable gains on the sale of the shares of Great Nordic, Atos Origin
andcertainactivitieswithintheCompany’smonitorandatTVbusiness,
are included in the line non-taxable income.
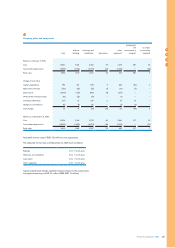
Deferred tax assets and liabilities
Deferred tax assets and liabilities relate to the following balance sheet
captions, of which the movements in temporary differences during
the year are as follows:
balance
Dec. 31,
2004
recog-
nized in
income
recog-
nized in
equity
balance
Dec. 31,
2005
Intangible assets (570) (110) (50) (730)
Property, plant and equipment 10 30 − 40
Inventories 120 30 − 150
Prepaid pension costs 60 (10) −− 50
Other receivables 40 − − 40
Other assets 300 (10) (30) 260
Provisions:
Pensions• 360 (100) 30 290
Restructuring• 30 − − 30
Guarantees• 20 (10) − 10
Terminationbenets• 80 (40) (10) 30
Otherpostretirementbenets• 90 10 −− 100
Other• 330 90 10 430
Other liabilities 40 32 60 132
Tax loss carryforward (including
tax credit carryforwards) 783 122 −− 905
Net deferred tax assets 1,693 34 10 1,737
In assessing the realizability of deferred tax assets, management considers
whether it is probable that some portion or all of the deferred tax assets
will not be realized. The ultimate realization of deferred tax assets is
dependent upon the generation of future taxable income during the periods
in which those temporary differences become deductible. Management
considers the scheduled reversal of deferred tax liabilities, projected
future taxable income and tax strategies in making this assessment.
In order to fully realize the deferred tax asset, the Company will need
to generate future taxable income in the countries where the net
operating losses were incurred. Based upon the level of historical
taxable income and projections for future taxable income over the
periods in which the deferred tax assets are deductible, management
believes it is probable that the Company will realize all or some portion
ofthebenetsofthesedeductibledifferences.
IFRS information