Philips 2005 Annual Report Download - page 93
Download and view the complete annual report
Please find page 93 of the 2005 Philips annual report below. You can navigate through the pages in the report by either clicking on the pages listed below, or by using the keyword search tool below to find specific information within the annual report.-
 1
1 -
2
-
3
-
4
-
5
-
6
-
7
-
8
-
9
-
10
-
11
-
12
-
13
-
14
-
15
-
16
-
17
-
18
-
19
-
20
-
21
-
22
-
23
-
24
-
25
-
26
-
27
-
28
-
29
-
30
-
31
-
32
-
33
-
34
-
35
-
36
-
37
-
38
-
39
-
40
-
41
-
42
-
43
-
44
-
45
-
46
-
47
-
48
-
49
-
50
-
51
-
52
-
53
-
54
-
55
-
56
-
57
-
58
-
59
-
60
-
61
-
62
-
63
-
64
-
65
-
66
-
67
-
68
-
69
-
70
-
71
-
72
-
73
-
74
-
75
-
76
-
77
-
78
-
79
-
80
-
81
-
82
-
 83
83 -
 84
84 -
 85
85 -
 86
86 -
 87
87 -
 88
88 -
 89
89 -
 90
90 -
 91
91 -
 92
92 -
 93
93 -
 94
94 -
 95
95 -
 96
96 -
 97
97 -
 98
98 -
 99
99 -
 100
100 -
 101
101 -
 102
102 -
 103
103 -
104
-
105
-
106
-
107
-
108
-
109
-
110
-
111
-
112
-
113
-
114
-
115
-
116
-
117
-
118
-
119
-
120
-
121
-
122
-
123
-
124
-
125
-
126
-
127
-
128
-
129
-
130
-
131
-
132
-
133
-
134
-
135
-
136
-
137
-
138
-
139
-
140
-
141
-
142
-
143
-
144
-
145
-
146
-
147
-
148
-
149
-
150
-
151
-
152
-
153
-
154
-
155
-
156
-
157
-
158
-
159
-
160
-
161
-
162
-
163
-
164
-
165
-
166
-
167
-
168
-
169
-
170
-
171
-
172
-
173
-
174
-
175
-
176
-
177
-
178
-
179
-
180
-
181
-
182
-
183
-
184
-
185
-
186
-
187
-
188
-
189
-
190
-
191
-
192
-
193
-
194
-
195
-
196
-
197
-
198
-
199
-
200
-
201
-
202
-
203
-
204
-
205
-
206
-
207
-
208
-
209
-
210
-
211
-
212
-
213
-
214
-
215
-
216
-
217
-
218
-
219
-
220
-
221
-
222
-
223
-
224
-
225
-
226
-
227
-
228
-
229
-
230
-
231
-
232
 |
 |
Philips Annual Report 2005 93
Liquidity and capital resources
Cash fl ows
Condensed consolidated statements of cash fl ows for the
years ended December 31, 2005, 2004 and 2003 are
presented below:
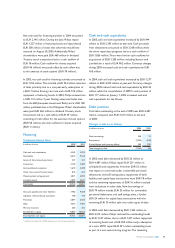
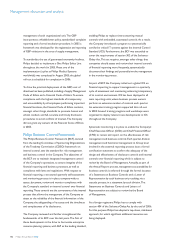
Condensed cash fl ow statements
in millions of euros 2003
1) 2004
1) 2005
Cash fl ows from operating activities:
Income from continuing operations 723 2,815 2,951
Adjustments to reconcile net income
to net cash provided by (used for)
operating activities 1,289 (192 ) (861 )
Net cash provided by operating
activities 2,012 2,623 2,090
Net cash provided by investing
activities 766 668 1,298
Cash fl ows before fi nancing activities 2,778 3,291 3,388
Net cash used for fi nancing activities (1,355 ) (2,145 ) (2,589 )
Cash provided by continuing
operations 1,423 1,146 799
Effect of changes in consolidations on
cash positions − 117 −
Effect of changes in exchange rates on
cash positions (165 ) (45 ) 160
Net cash (used for) provided by
discontinued operations (44 ) 59 (15 )
Cash and cash equivalents at
beginning of year 1,858 3,072 4,349
Cash and cash equivalents at end
of year 3,072 4,349 5,293
1) Restated to present the MDS activities as a discontinued operation
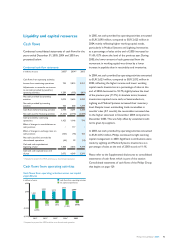
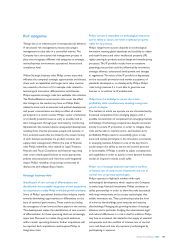
Cash fl ows from operating activities
Cash fl ows from operating activities versus net capital
expenditures
cash flows from operating activitie
s
net capital expenditures
in millions of euros
4,000
2,000
0
(2,000)
(4,000)
1,281
(2,082)
20011) 20021) 20031) 20041)
2,223
(920)
2,012
(832)
2,623
(1,185)
2,090
(819)
2005
1) Restated to present the MDS activities as a discontinued operation
In 2005, net cash provided by operating activities amounted
to EUR 2,090 million, compared to EUR 2,623 million in
2004, mainly refl ecting higher working capital needs,
particularly in Medical Systems and Lighting. Inventories
as a percentage of sales at the end of 2005 increased to
11.4%, 0.7% above the level of the previous year. During
2005, the lower amount of cash generated from the
movement in working capital was driven by a
lower
increase in payables than in receivables and inventories.
In 2004, net cash provided by operating activities amounted
to EUR 2,623 million, compared to EUR 2,012 million in
2003, refl ecting the higher income and lower working
capital needs. Inventories as a percentage of sales at the
end of 2004 decreased to 10.7%, slightly below the
level
of the previous year (11.1%). In absolute terms, however,
inventories required more cash, as Semiconductors,
Lighting and Medical Systems increased their inventory
level. Despite lower outstanding trade receivables in
months’ sales (0.1 month), the receivables increased due
to the higher sales level in December 2004 compared to
December 2003. This was fully offset by extended credit
terms given by suppliers.
In 2003, net cash provided by operating activities amounted
to EUR 2,012 million. Philips continued its tight working
capital management in 2003. Signifi cant contributions were
made by Lighting and Medical Systems. Inventories as a
percentage of sales at the end of 2003 stood at 11.1%.
Please refer to the Supplemental disclosures to consolidated
statements of cash fl ows which is part of the section
Consolidated statements of cash fl ows of the Philips Group
that begins on page 129.