Philips 2005 Annual Report Download - page 79
Download and view the complete annual report
Please find page 79 of the 2005 Philips annual report below. You can navigate through the pages in the report by either clicking on the pages listed below, or by using the keyword search tool below to find specific information within the annual report.-
 1
1 -
2
-
3
-
4
-
5
-
6
-
7
-
8
-
9
-
10
-
11
-
12
-
13
-
14
-
15
-
16
-
17
-
18
-
19
-
20
-
21
-
22
-
23
-
24
-
25
-
26
-
27
-
28
-
29
-
30
-
31
-
32
-
33
-
34
-
35
-
36
-
37
-
38
-
39
-
40
-
41
-
42
-
43
-
44
-
45
-
46
-
47
-
48
-
49
-
50
-
51
-
52
-
53
-
54
-
55
-
56
-
57
-
58
-
59
-
60
-
61
-
62
-
63
-
64
-
65
-
66
-
67
-
68
-
 69
69 -
 70
70 -
 71
71 -
 72
72 -
 73
73 -
 74
74 -
 75
75 -
 76
76 -
 77
77 -
 78
78 -
 79
79 -
 80
80 -
 81
81 -
 82
82 -
 83
83 -
 84
84 -
 85
85 -
 86
86 -
 87
87 -
 88
88 -
 89
89 -
90
-
91
-
92
-
93
-
94
-
95
-
96
-
97
-
98
-
99
-
100
-
101
-
102
-
103
-
104
-
105
-
106
-
107
-
108
-
109
-
110
-
111
-
112
-
113
-
114
-
115
-
116
-
117
-
118
-
119
-
120
-
121
-
122
-
123
-
124
-
125
-
126
-
127
-
128
-
129
-
130
-
131
-
132
-
133
-
134
-
135
-
136
-
137
-
138
-
139
-
140
-
141
-
142
-
143
-
144
-
145
-
146
-
147
-
148
-
149
-
150
-
151
-
152
-
153
-
154
-
155
-
156
-
157
-
158
-
159
-
160
-
161
-
162
-
163
-
164
-
165
-
166
-
167
-
168
-
169
-
170
-
171
-
172
-
173
-
174
-
175
-
176
-
177
-
178
-
179
-
180
-
181
-
182
-
183
-
184
-
185
-
186
-
187
-
188
-
189
-
190
-
191
-
192
-
193
-
194
-
195
-
196
-
197
-
198
-
199
-
200
-
201
-
202
-
203
-
204
-
205
-
206
-
207
-
208
-
209
-
210
-
211
-
212
-
213
-
214
-
215
-
216
-
217
-
218
-
219
-
220
-
221
-
222
-
223
-
224
-
225
-
226
-
227
-
228
-
229
-
230
-
231
-
232
 |
 |
Philips Annual Report 2005 79
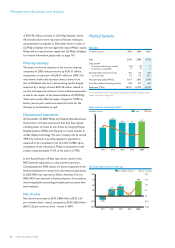
Semiconductors
Key data
in millions of euros 2003
1) 2004
1) 2005
Sales 3,888 4,491 4,620
Sales growth
% increase (decrease), nominal (7 ) 16 3
% increase, comparable 4 18 0
Earnings before interest and tax (328 ) 430 307
as a % of sales (8.4 ) 9.6 6.6
Net operating capital (NOC) 2,481 2,520 2,363
Cash fl ows before fi nancing activities 1,446 658 675
Employees (FTEs) 30,763 32,580 35,637
1) Restated to present the MDS activities as a discontinued operation
For a reconciliation to the most directly comparable US GAAP measures, see the
section that begins on page 120.
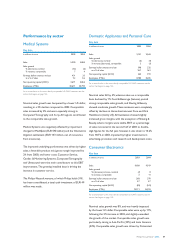
Sales and net operating capital1)
in billions of euros sales NOC
8
6
4
2
0
2001 2002 2003 2004 2005
4.1 4.2 3.9
4.5 4.6
1) Restated to present the MDS activities as a discontinued operation
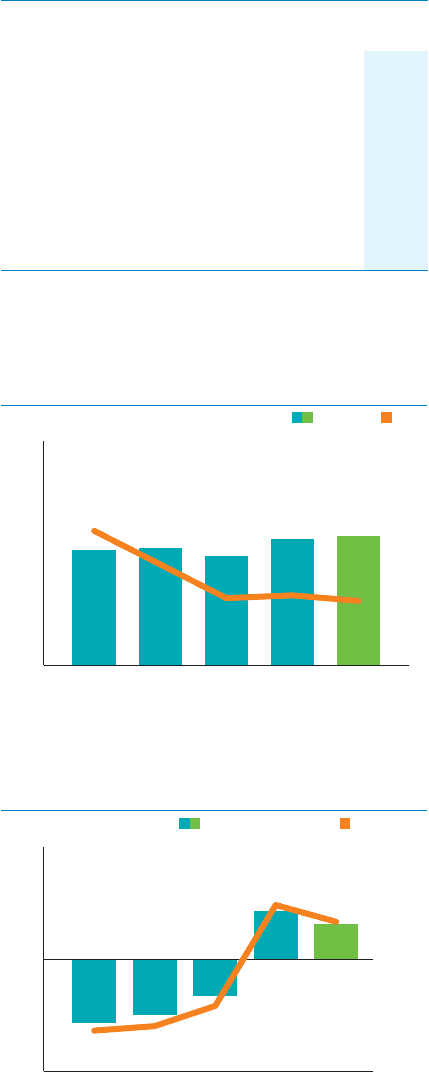
Earnings before interest and tax1)
as a % of sale
s
1,000
500
0
(500)
(1,000)
20%
10%
0%
(10%)
(20%)
2001 2002 2003 2004 2005
(572) (502)
(328)
430
307
in millions of euros
1) Restated to present the MDS activities as a discontinued operation
Market developments
Following a very strong year in 2004, with 28% growth
in US dollar terms for the total semiconductors market,
growth slowed down considerably to 6% in 2005. After
a dip in the fi rst half of the year, caused by a clearing of
inventories in the end channels, markets recovered for
the seasonally stronger second half of the year. The mobile
phone market, though slowing down compared to 2004,
ended the year at a level of 810 million handsets and was
still the main driver behind the Mobile & Personal market
growth. The markets for Automotive & Identifi cation and
standard products grew in line with the total market. Home
market growth is expected to increase in the coming
years, as digital TV sets further replace analog systems.
Business developments
In 2005, as part of its Business Renewal Program,
Semiconductors took actions to further improve its
performance, thereby aiming to achieve a consistent EBIT
margin in the range of 5-15% through the semiconductor
cycle. As part of the Business Renewal Program, a
EUR 250 million cost saving program has been started.
In December 2005, Philips announced its intention to
create a separate legal structure for Semiconductors.
This will give the division the fl exibility to pursue strategic
options to strengthen its long-term performance.
Financial performance
Sales for the full year grew by 3% on a nominal basis and
remained fl at on a comparable basis. Semiconductors’
sales accelerated in the second half of the year as the
markets improved and the division engaged more aggressively
in winning additional sales, the latter resulting from the
Business Renewal Program which started in mid 2005.
The Mobile & Personal segment was the main contributor
to the sales growth, with nominal growth of 8%, together
with the Home segment with sales growth of 9%. The
MultiMarket Semiconductors segment showed a nominal
sales decline of 2% due to portfolio choices. Adjusted for
portfolio choices made, this segment gained market share
in 2005. Automotive & Identifi cation showed growth of 2%.
Sales growth in Asia Pacifi c was 10% nominal. In Europe
sales declined by 7% as manufacturers are moving to Asia.